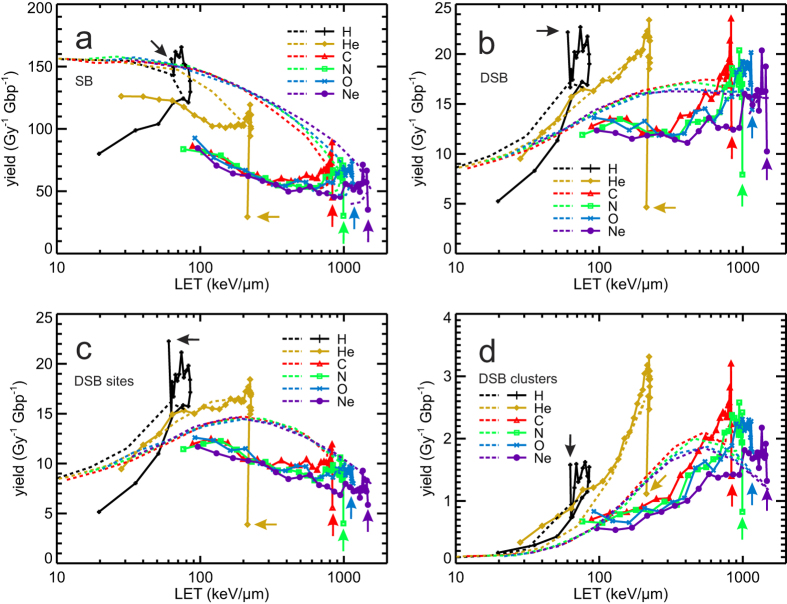
Figure 6. Simulated DNA damage induced in slabs of 200 nm thickness by ions with 0.25 MeV/u initial energy in dependence on the LET within that slab (Fig. 2b).
Symbols connected by solid lines to guide the eye refer to subsequent slabs; dotted lines show the total damage yields in dependence on the nucleus-averaged LET (presented in Fig. 3b–d). Panel a: SB yields from direct and indirect effects. Panel b: DSB yields, in which isolated ones as well as individual DSB in DSB clusters are scored. Panel c: Yields of DSB sites, which comprise isolated DSB and DSB clusters; a DSB cluster is scored as one DSB site. Panel d: Yields of DSB clusters; a cluster includes two or more DSB within not more than 25 bp distance. The LET and the yields of DNA damage in the first slab are indicated by arrows; when the ion slows down, the damage yields proceed along the solid lines.

