Figure 1.
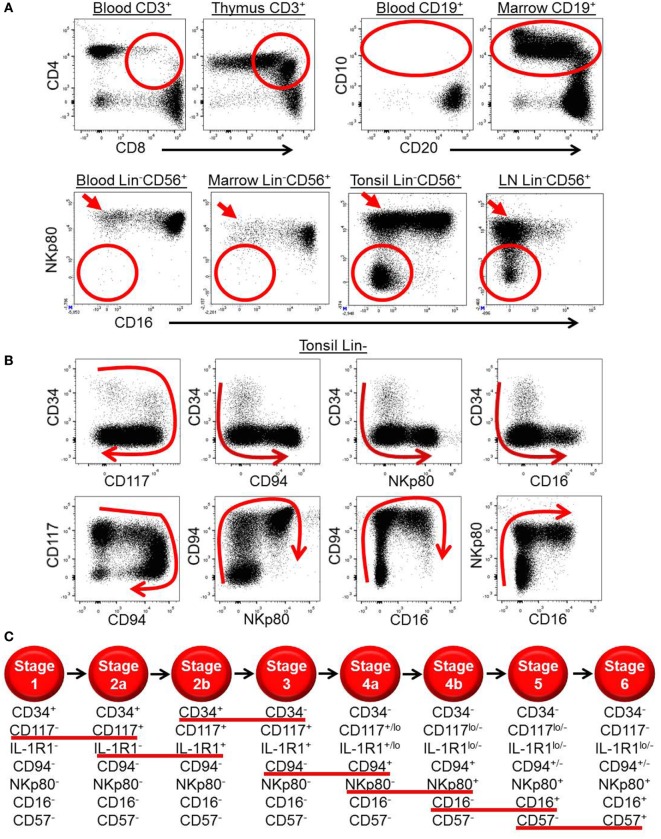
Ex vivo patterns of surface antigen expression support a model of human natural killer (NK) cell development in secondary lymphoid tissues (SLTs). (A) Ex vivo immunophenotypic analyses of CD3+ cells (top row, left plots), CD19+ cells (top row, right plots), and Lin−CD56+ cells (bottom row) in the indicated tissues demonstrate how immature T, B, and NK cell developmental intermediates (designated by the red circles and ovals) are naturally enriched in the thymus, bone marrow, and SLTs, respectively. Of note, the SLT populations designated by the red circles in the bottom row also likely contain some ILC3s, which can express CD56 (14). The red arrows in the bottom row highlight the relative enrichment of stage 4b CD56brightNKp80+CD16− NK cells in SLTs. (B) Immunophenotypic analysis of Lin− ILCs in human tonsil demonstrating the two-way patterns of CD34, CD117, CD94, NKp80, and CD16 expression as they relate to one another. The red arrows depict the putative directions of progressive NK cell development in SLTs. (C) Schematic representation of the proposed stages of human NK cell development in SLTs. The stages are defined according to the differential expression of CD34, CD117, interleukin (IL)-1R1, CD94, NKp80, CD16, and CD57, and the red lines underline the surface antigen changes that define each stage transition. Although not depicted, it is noted that CD56 expression is first detected at stage 2b (heterogeneous), peaks at stage 4b (CD56bright), and then decreases to the level of most peripheral blood NK cells at stage 6 (CD56dim). Also not depicted is killer immunoglobulin-like receptor expression, which is first detected within stage 4b in SLTs (40).

