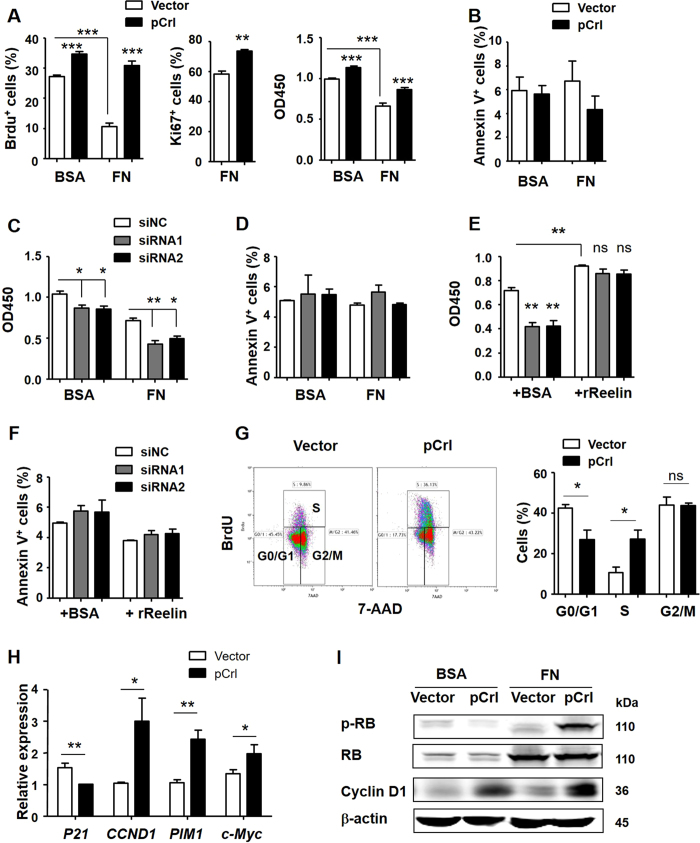
Figure 2. Reelin promotes MM cell proliferation in vitro.
(A) Reelin over-expression promotes H929 cell proliferation in the presence or absence of fibronectin. H929 cells were transfected with 10 μg pCrl or control vector for 40 hours. The cells were then seeded in 5% BSA- or 40 μg/ml FN-coated plates in the absence of cytotoxic agents. Twenty-four hours later, the cell proliferation was analyzed by BrdU, Ki67 and CCK8 method staining. (B) Reelin over-expression does not alter cell survival in the absence of chemotherapeutic agents. H929 cells were treated as (A). The cell apoptosis was analyzed by annexin V staining. (C,D) Reelin knockdown by specific siRNAs suppresses H929 cell proliferation. H929 cells were transfected with 300 pmol Reelin specific siRNA or control siRNA (siNC) for 40 hours. The cells were then seeded in BSA- or FN-coated plates. The cell growth (C) and apoptosis (D) were analyzed 24 hours later by CCK8 method and annexin V staining, respectively. (E,F) The addition of Reelin reverses cell growth inhibition induced by Reelin-specific siRNAs. H929 cells were transfected with Reelin specific siRNAs or control siRNA. The cells were then seeded in FN-coated plates with recombinant Reelin (rReelin) or BSA control. The cell proliferation (E) and apoptosis (F) were analyzed 24 hours later. (G) Reelin promotes myeloma cell cycle progression from G1 to S phase. Reelin-overexpressing H929 cells were seeded in FN-coated plates for 24 hours. The cell cycle analysis by flow cytometry was then performed. (H) The transfection of H929 cells with pCrl alters the transcription of proliferation-related genes. (I) Reelin over-expression increased the levels of phosphorylated Rb and total Cyclin D1. The cells in (A) were harvested and cell lysates were subjected to western blotting with phospho-Rb (Ser780), Rb, and Cyclin D1-specific antibodies. An antibody specific for GAPDH was used as a loading control. The experiments were performed for 3 times and similar results were obtained. Error bars indicate the standard deviation. The data were evaluated by two-tailed Student’s t-test. *p < 0.05, **p < 0.01, ***p < 0.005.

