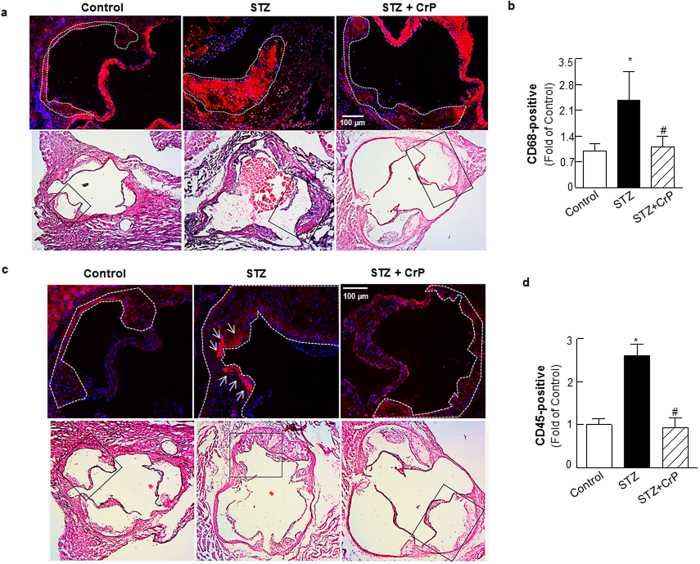
Figure 5. Chromium picolinate in vivo prevents hyperglycemia-induced macrophage and leukocyte infiltration into aortic root lesions of STZ-treated ApoE−/− mice.
Shown are representative images and summary data for quantification of (a,b) CD68-positive staining and (c,d) CD45-positive staining. All images were captured at 15X magnification. Histology of the immunofluorescence images are shown in the corresponding H & E-stained images (indicated by the black box). Specific regions of the immunofluorescence images used for data analyses are marked by dotted lines. Results are presented as fold of Control and all values are expressed are mean ± SD (for CD45, Control: n = 6; STZ: n = 6; STZ+CrP: n = 5; for CD68, Control: n = 5; STZ: n = 5; STZ+CrP: n = 5); *p ≤ 0.0008 vs. Control; #p ≤ 0.0018 vs. STZ.

