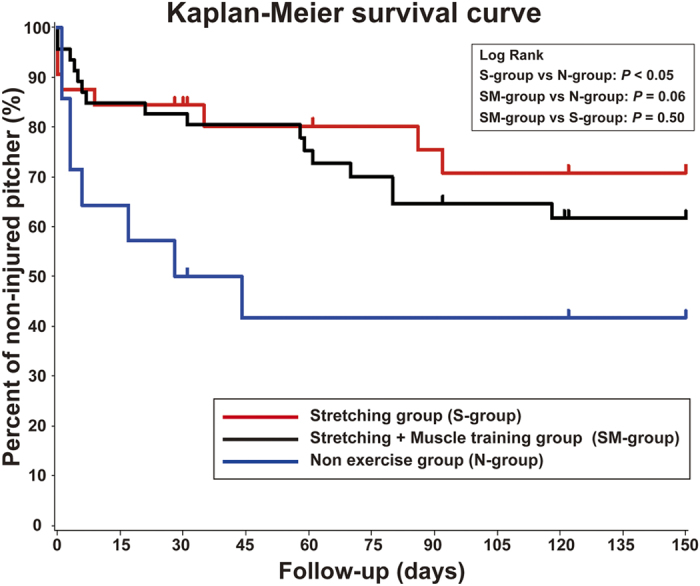
Figure 1. Kaplan-Meier survival curves.

The median survival times were 89, 92, and 29.5 days in the S-, SM-, and N-group, respectively. A log-rank test showed that injury incidence was significantly lower in the S-group than in the N-group (p = 0.04). There were no significant differences between the S- and SM-group (p = 0.50), or between the SM- and N-group (p = 0.06).
