
Figure 4. Comparison of EMG ↔ SBP causality (mean ± SD) between two population groups.
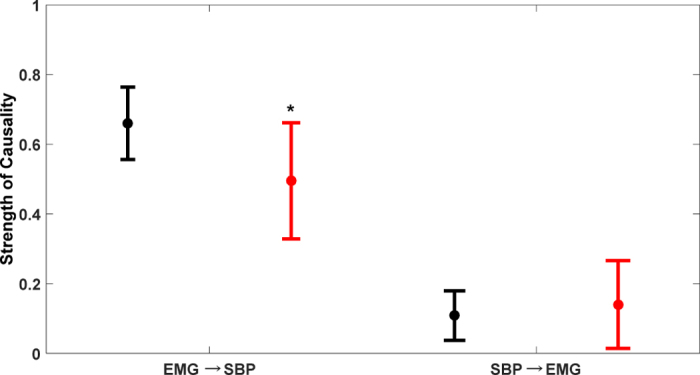
In elderly group (red) the strength of EMG → SBP causality declined significantly (p = 0.002) while SBP → EMG causality did not change (p = 0.37) compared to young group (black). *Represents significant difference at α = 0.01.