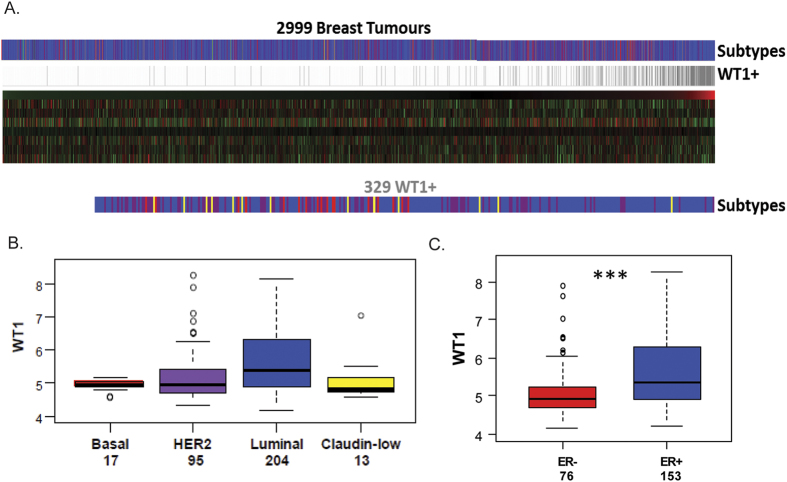
Figure 1. WT1 expression in human primary breast cancer datasets.
(A) Gene expression analysis data from 17 integrated datasets (n = 2999 tumours). (B) Boxplot of WT1 expression in the different subtypes, y-axis showing log2 values. (C) Boxplots of WT1 expression in ER-positive (blue) and ER-negative (red) tumours designated by IHC of ER-alpha amongst those tumours with detectable expression of WT1, ***p < 0.001.

