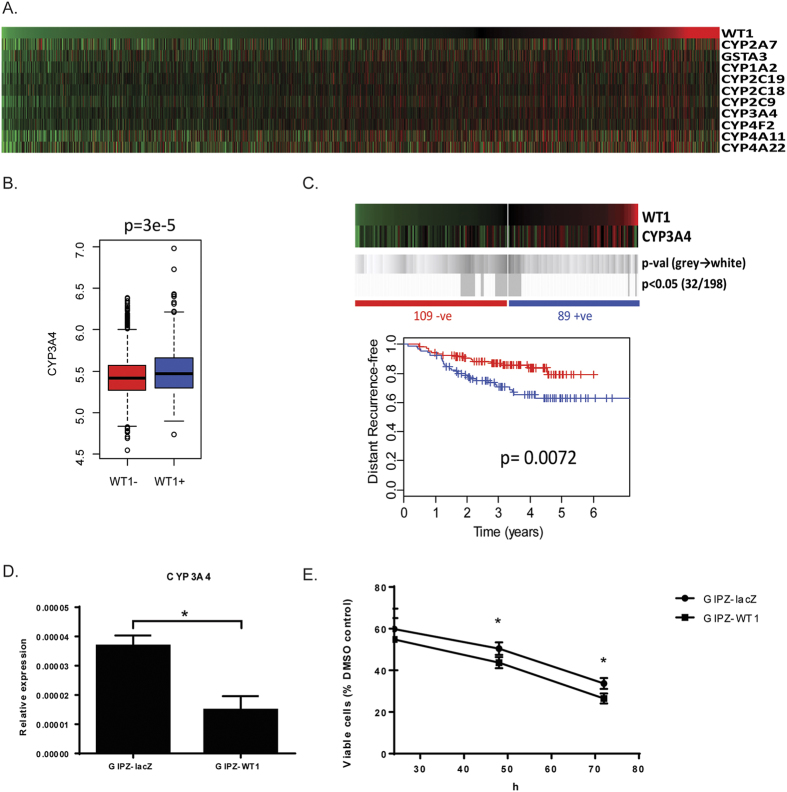
Figure 8. WT1 expression in breast cancer correlates with cytochrome P450 family members and poor response to taxane treatment.
(A) Heatmap showing ranked expression of WT1 alongside cytochrome P450 genes obtained from 17 integrated published microarray datasets (n = 2999 tumours). (B) Boxplot of CYP3A4 expression in the WT1-positive and WT1-negative samples. (C) Kaplan Meier survival analysis of 198 breast cancer patients treated with taxane-anthracycline chemotherapy (Dataset GSE25065) demonstrates that WT1 expression is associated with worse outcomes. Heatmaps show log2 mean-centered expression values, red = high, green = low. Shades of grey to white indicate p-values of log-rank (Mantel-Cox) tests at all possible cut-points are shown in grey. Vertical bars on survival curves indicate censored cases. (D) Quantitative real-time PCR of CYP3A4 mRNA in MDA-MB-157 cells transduced with pGIPZ-miR: data points represent the relative expression of the gene, error bars represent the standard deviation of two separate biological replicates (*p < 0.05). (E) Cytotoxycity of docetaxel is increased in MDA-MB-157 cells transduced with pGIPZ-miR. Mean and standard deviation of three independent experiments are plotted (*p < 0.05).

