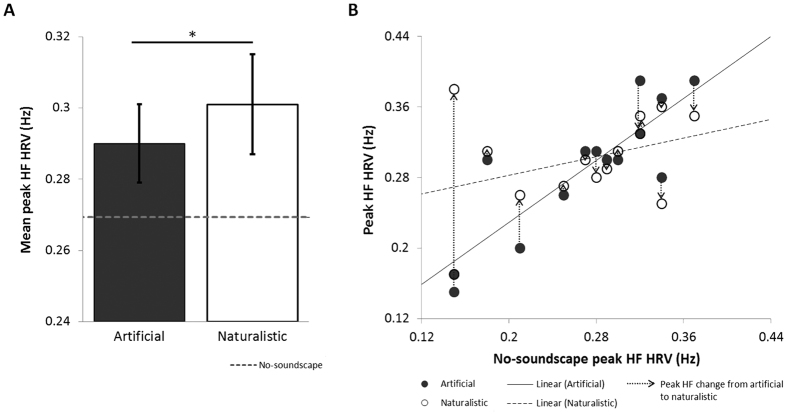
Figure 3.
(A) Significant increase in the mean peak of the high frequency component of heart rate variability (peak HF HRV) in naturalistic familiar compared to artificial familiar conditions, after controlling for the baseline (no-soundscape) high frequency peak. Error bars ± 1 SEM. *p < 0.05 (B) Interaction between baseline (no-soundscape) peak HF and artificial familiar (dark circle, solid line) and naturalistic familiar (white circle, dashed line) peak HF. Individuals with low baseline peak HF show an increase in parasympathetic tone from artificial to naturalistic conditions (upwards arrow); individuals with high baseline peak HF show a decrease in parasympathetic tone from artificial to naturalistic conditions (downwards arrow).

