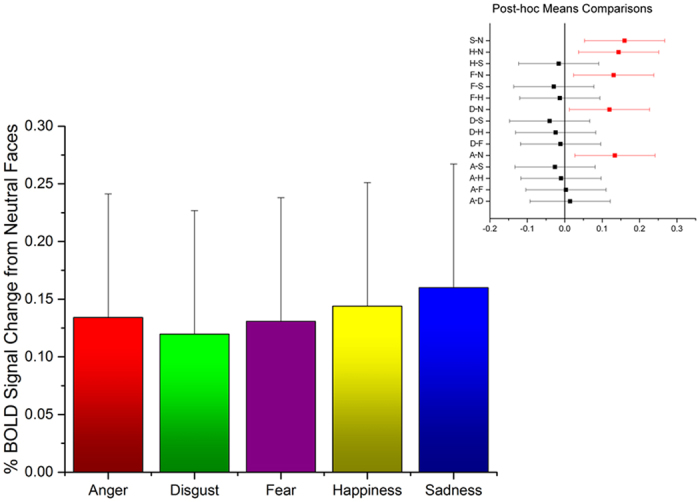
Figure 1. Difference in amygdala percentage of BOLD signal change between each emotional expression and neutral faces (mean ± SEM).

The inset reports the results of post-hoc comparisons between each possible pair of expressions (mean ± SEM; red lines denote statistically significant differences at p < 0.05). Abbreviations: A, Anger; D, Disgust; F, Fear; H, Happiness; N, Neutral; S, Sadness.
