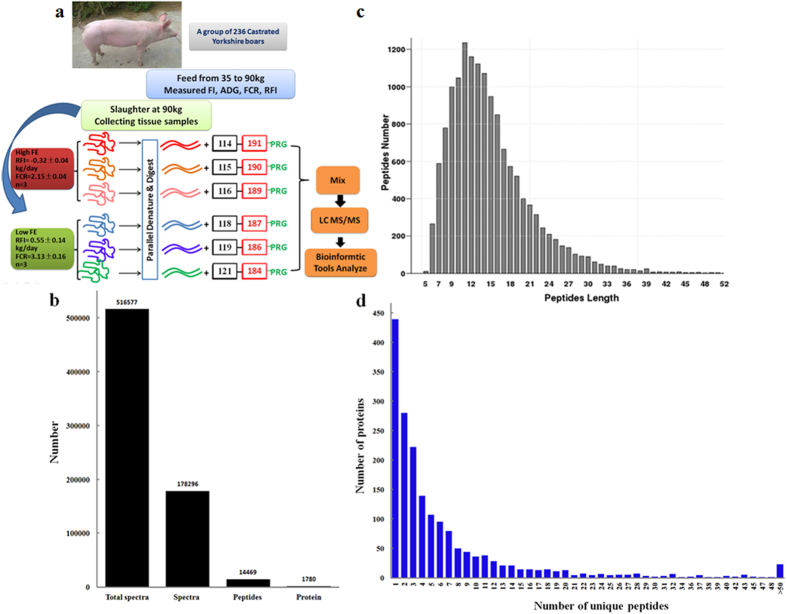
Figure 1. Proteomic analysis using the iTRAQ method.
(a) Workflow for the iTRAQ method. The samples of three high-FE pigs were labeled with 114, 115, and 116 iTRAQ tags. The samples of three low-FE pigs were labeled with 118, 119, and 121 iTRAQ tags. (b) Total spectrum, peptides and proteins identified by the iTRAQ method. (c) Distribution of peptide lengths. (d) Distribution of proteins based on the number of peptides.

