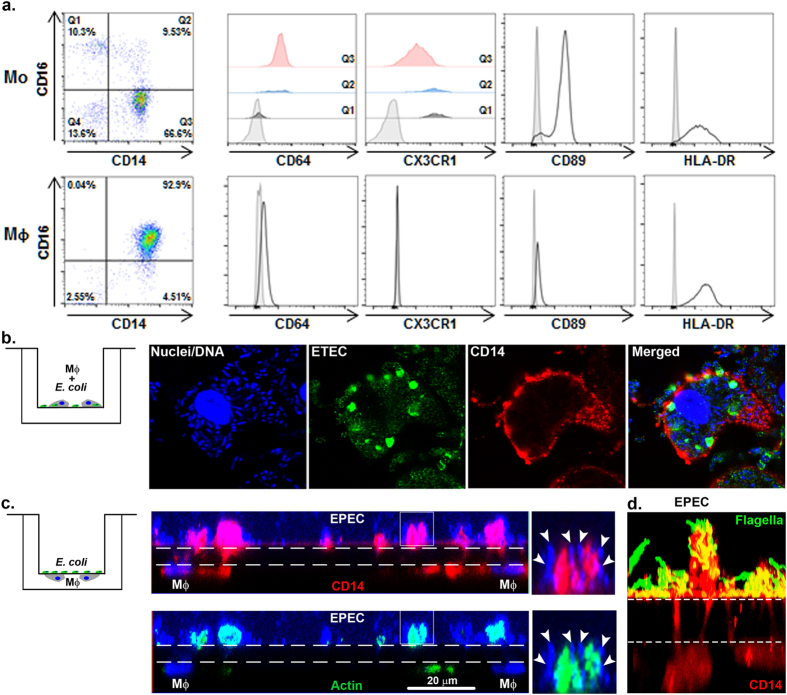
Figure 2. Human macrophages display immune phenotype and bacterial sensing.
(a) Freshly isolated human monocytes (Mo; upper panels) and the derivative differentiated macrophages (MΦ; lower panels) were assessed by flow cytometry for surface expression of immune cell markers including CD14 and CD16 (shown as dot plots) and CD64, CX3CR1, CD89 and HLA-DR (shown as histograms). For Mo, the three main populations were reported as Q1, Q2 and Q3. (b) ETEC incubated with MΦ (schematic representation, left panel). Following overnight infection, bacteria were phagocytosed by MΦ. DNA, blue; ETEC, green; CD14 (MΦ), red. (c,d) MΦ were seeded underneath the filter with EPEC added onto the insert (schematic representation, left panel). MΦ extended projections across the 1.0 μm pore insert filter to reach EPEC, added on the opposite surface of the insert membrane. Dashed lines indicate the position of the 1.0 μm filter. (c) DNA, blue; actin, green; CD14, red; EPEC DNA, arrowheads. (d) EPEC flagella, green; CD14, red.

