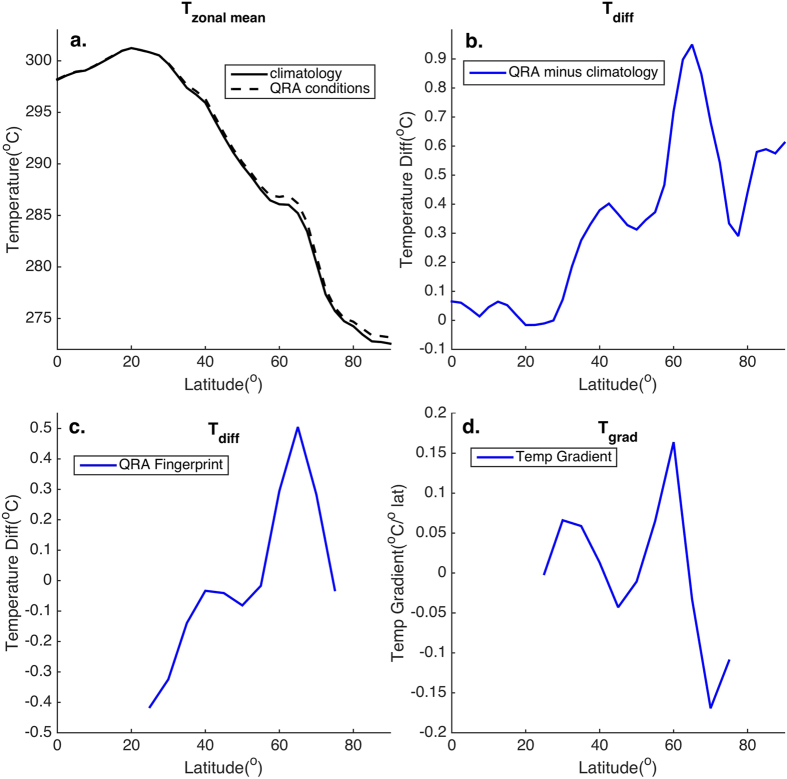
Figure 1. Boreal Summer (JJA) Zonal Mean Temperature Profiles.
Shown are (a) JJA 1000 mb temperatures from ERA reanalysis data (1979–2015) for both climatological mean and QRA-favorable conditions (at 2.5° latitudinal resolution), (b) The difference between the two i.e. the anomalous zonal mean temperature profile associated with QRA-favorable conditions, (c) The QRA fingerprint defined as the former quantity, confined to the extatropical region 25–75N, centered on zero, and interpolated onto 5° latitudinal grid commensurate with model simultions, and (d) the associated meridional temperature gradient.

