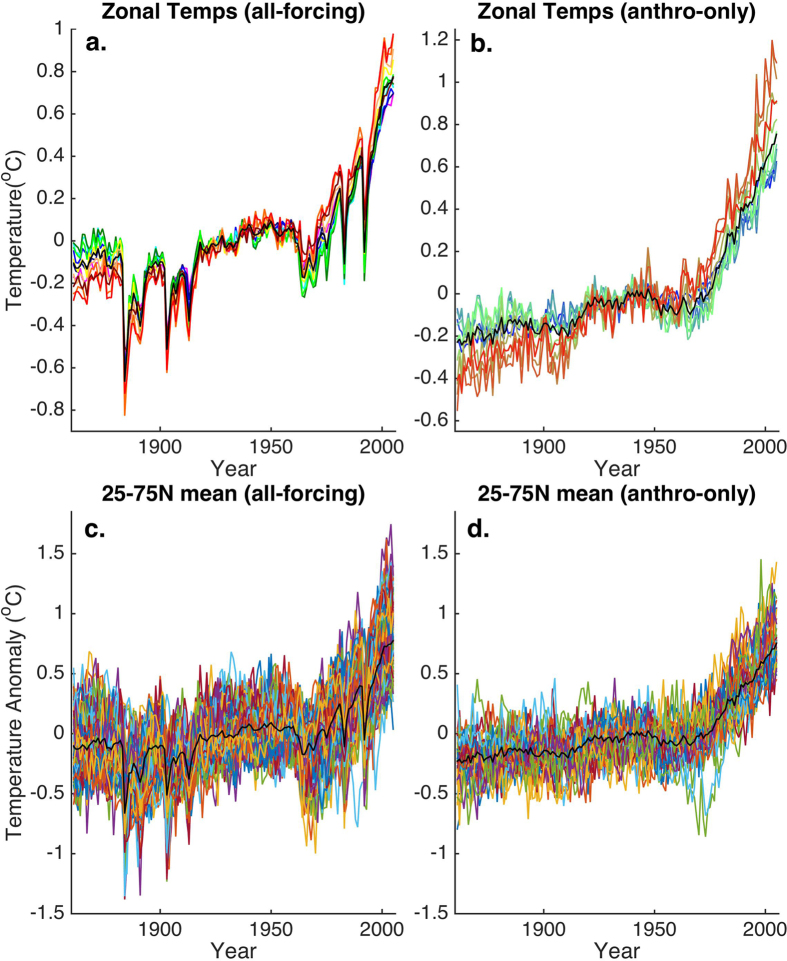
Figure 2. Zonal mean temperatures for 5 degree bands from 25–75N in the CMIP5 historical simulations.
Shown are the multimodel means for the (a) all-forcing and (b) anthropogenic-only simulations. Rainbow scale is used to denote increasing latitude from 25N (violet) to 75N (red). The extratropical 25–75N mean series is shown for comparison (black). Shown also for both the (c) all-forcing and (d) anthropogenic-only simulations is the extratropical mean series for each member of the multimodel ensemble (colored curves) along with the multimodel mean (black) series.

