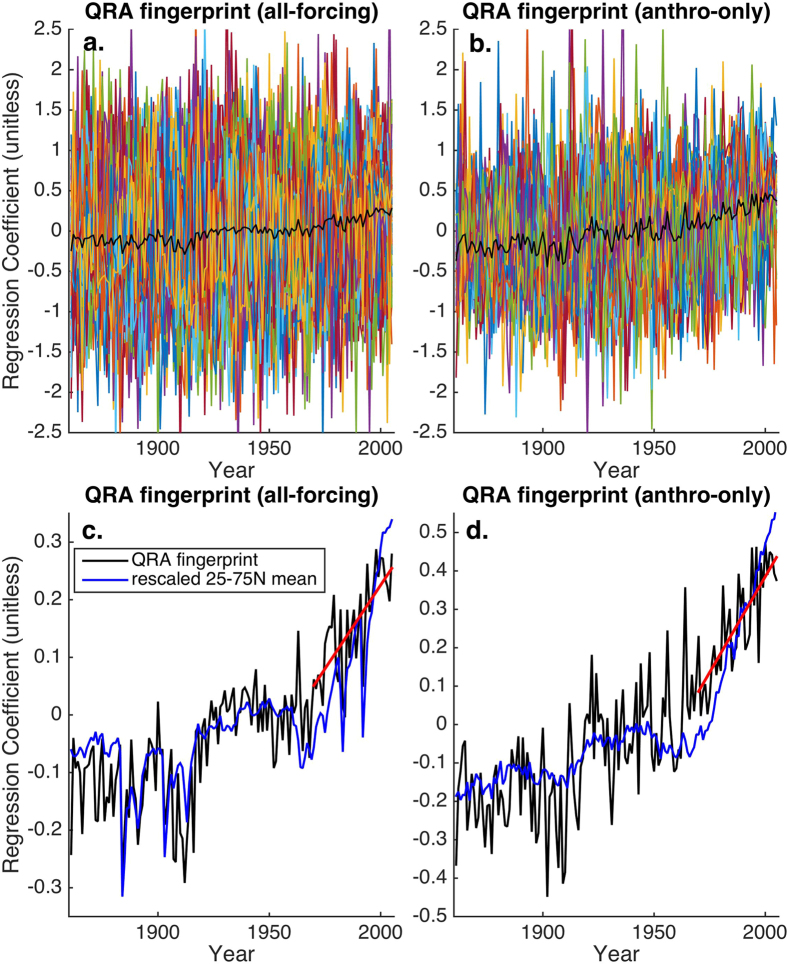
Figure 3. QRA Fingerprint Series.
Shown for both the (a) all-forcing and (b) anthropogenic-only simulations is the QRA series for each member of the multimodel ensemble (colored curves) along with the multimodel mean (black) series. The corresponding multimodel mean QRA series are shown along with the exatropical mean temperatures series for the (c) all forcing and (d) anthropogenic-only simulations, along with the linear trend over 1970–2005 (red line).

