
Figure 4. Time-dependent tension equilibration in the DHB.
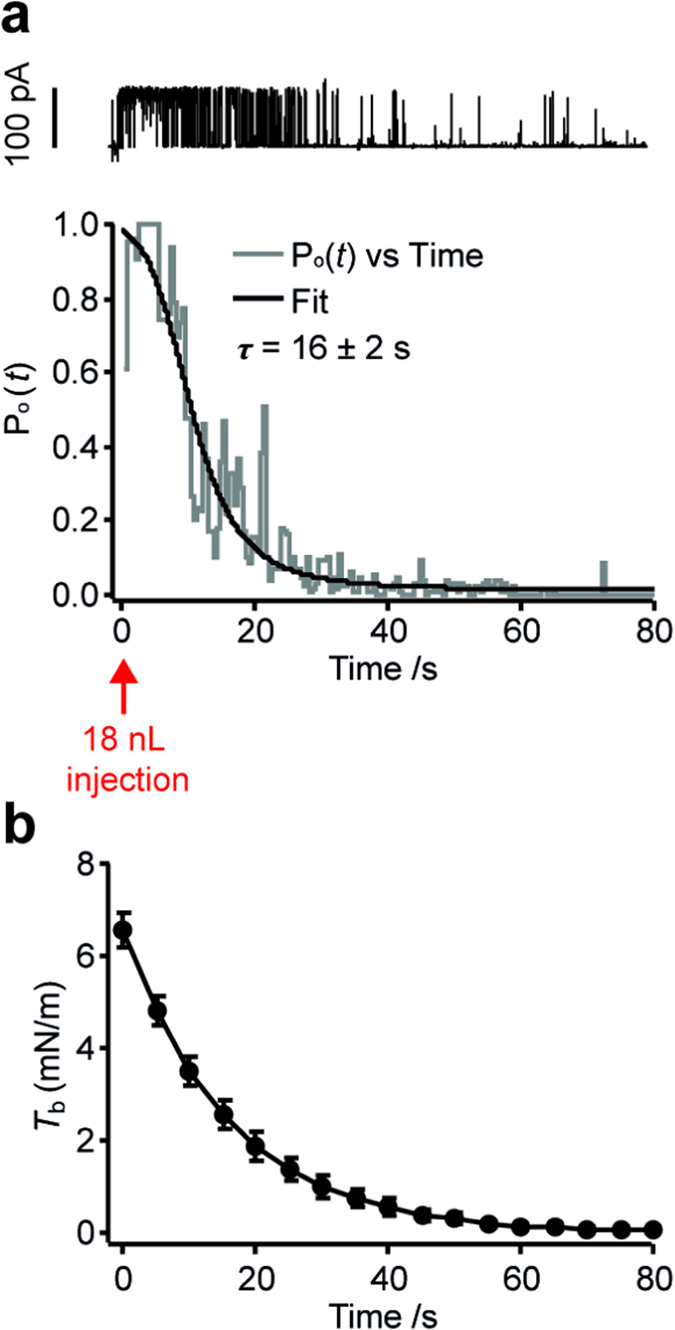
(a) Top: Current trace of channel activity, recorded at +30 mV in DHBs containing MscL-G22S, upon the injection of 18 nL experiment buffer into the droplet. Bottom: The corresponding plot of channel open probability, Po(t), as a function of time taken as the average between three individual experiments (see Supplementary Fig. S9). Assuming an exponential tension decay, we can fit a model to the data (solid black line) and extract the bilayer tension decay rate, τ = 16 ± 2 s. (b) The DHB tension, quantified in (a), as a function of time upon injection of 18 nL buffer. The error bars are propagated from the s.e.m. on the initial tension quantified in Fig. 3 (6.6 ± 0.4 mN/m) and the s.d. on the extracted decay rate.