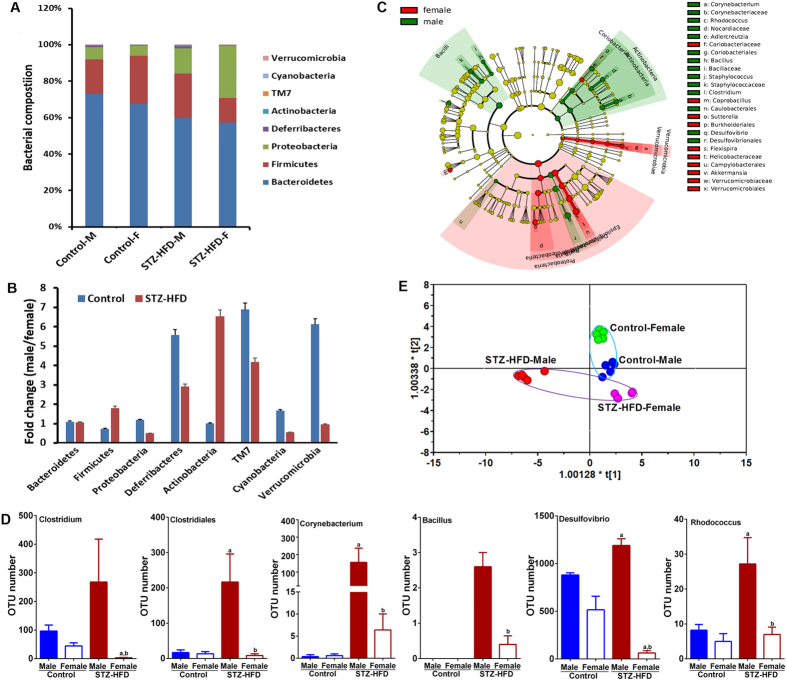
Figure 2.
(A) Bar charts summarizing overall microbial composition of control (n = 5) and STZ-HFD mice (n = 5) at phylum level. (B) Fold change of gut microbiota at the phylum level in males relative to females in both control group and STZ-HFD group. (C) Taxonomic representation of statistical differences in relative abundances between STZ-HFD-exposed female and male mice. Linear discriminant analysis Effect Size (LEfSe) was conducted on relative taxonomic abundances from phylum until genus level. Differences are represented in the colour of the most abundant class (red: female, green: male, yellow: non-significant (p < 0.05)). Each circle’s diameter is proportional to the taxon’s abundance. (D) Bar charts of representative gut microbiota involved in BA metabolism with significant change due to STZ-HFD intervention. a,bp < 0.05, model vs. normal or normal male vs. normal female or model male vs model female (Mean ± SE). (E) OPLS-DA scores plot (R2X = 0.766, R2Y = 0.957, Q2 = 0.721) of mouse gut mcirobiota profiles involved in BA metabolism for classification by sex and STZ-HFD treatment.

