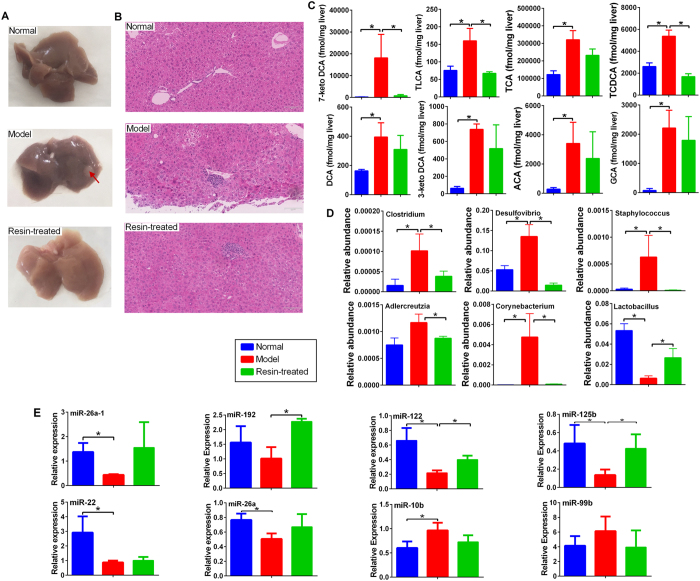
Figure 5.
(A) Representative macroscopic photographs of livers. Arrowheads indicate HCC. (B) H&E stained liver sections from normal, NASH-HCC and NASH-HCC-cholestyramine mice at week 20. Bar = 90 μm. (C) Levels of BAs significantly increased in NASH-HCC mice were attenuated after cholestyramine treatment. (D) Relative abundances of altered Clostridium, Desulfovibrio, Staphylococcus, Adlercreutzia, Corynebacterium and Lactobacillius were normalized after cholestyramine treatment. (E) Expression of altered miRNAs, miR-26a, miR-26a-1, miR-192, miR-122, miR-22, miR-125b, miR-10b and miR-99b were normalized after cholestyramine treatment.

