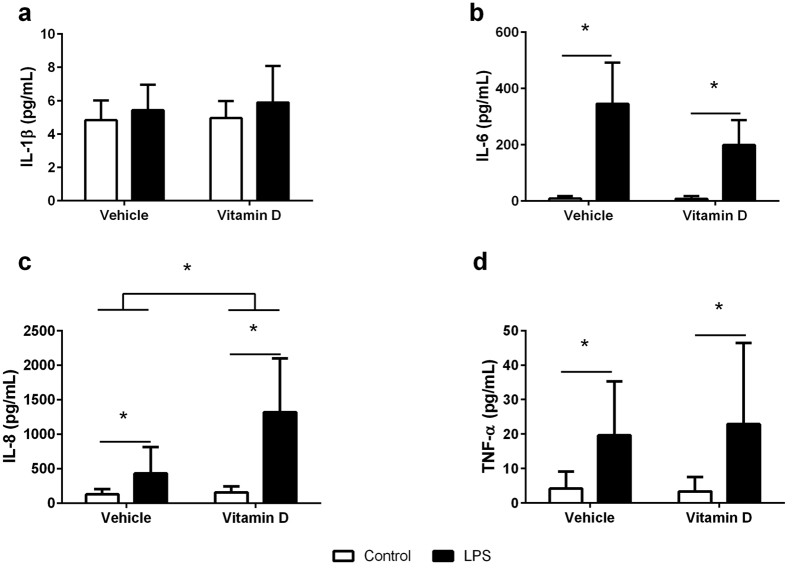
Figure 2.
Production of IL-1β (a), IL-6 (b), IL-8 (c) and TNF-α (d) in the supernatant of neutrophils with (black bars) and without (white bars) LPS in the presence of vehicle or vitamin D (1,25(OH)2D3). Data are represented as mean (SD), *indicates p < 0.05, n = 9/group for IL-1β testing, n = 5/group for IL-6 testing, n = 8/group for IL-8 testing, and n = 9/group for TNF-α testing.

