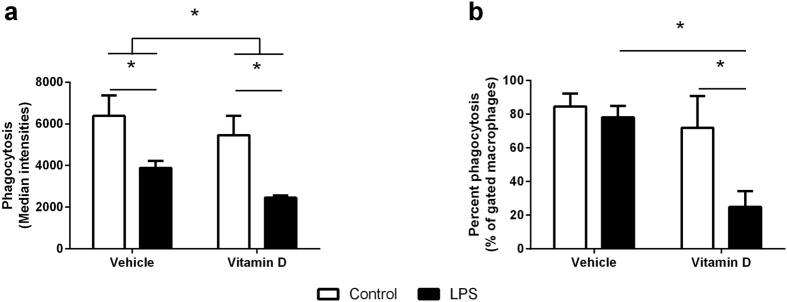
Figure 5.
Phagocytic capacity of macrophages measured as the total phagocytosis of E. coli (a) or the percentage of cells that phagocytosed E. coli (b) in macrophages treated with (black bars) or without (white bars) LPS in the presence of vehicle or vitamin D (1,25(OH)2D3). Data are represented as mean (SD), *indicates p < 0.05, n = 3/group.

