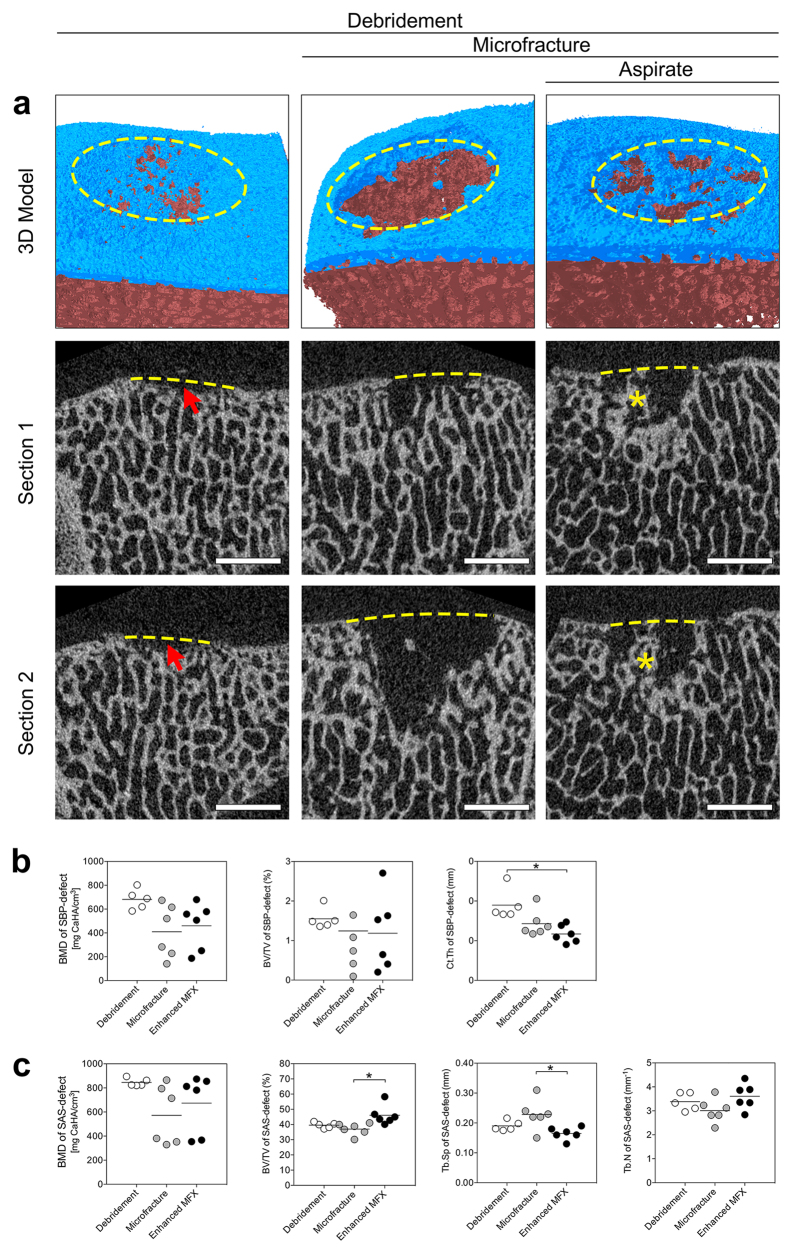
Figure 4. Qualitative and quantitative analysis of subchondral bone changes underlying defects treated with the three strategies.
(a) Representative micro-CT images of subchondral bone changes. The top row shows a 3D reconstruction of characteristic defects. The subchondral bone plate and subarticular spongiosa are colored in blue and red, respectively. The yellow dashed ellipse shows the margin of the defect. The middle and bottom rows represent two different sections of the defects of the top row. Removal of the calcified cartilage layer in the debridement group induced subchondral bone loss (red arrows). In defects from the microfracture and enhanced microfracture group, residual microfracture holes and peri-hole bone resorption were present. The yellow dashed lines indicate the projected cement lines, and the red asterisks indicate the preserved bone bridge between two residual microfracture holes. Scale bar: 2 mm. (b) Comparison of the micro-CT parameters of SBP-defect between the three treatment groups. *P < 0.05. (c) Comparison of the micro-CT parameters of SAS-defect between the three treatment groups. *P < 0.05.

