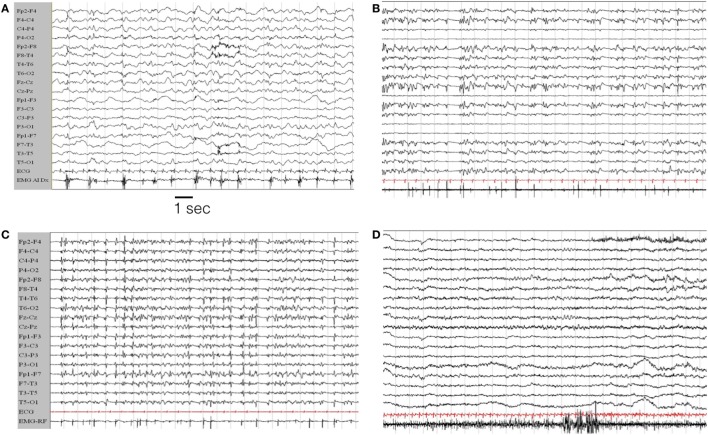
Figure 4.
EEG evolution in case # 1. (A) EEG during the initial hours of status epilepticus (SE). The patient was awake but confused with sub-continuous myoclonic jerks involving predominantly left limbs. The last channel records the surface EMG activity from the left anterior tibialis muscle. The EEG traces show a general slowing of the background activity, more evident on the right hemisphere, where periodic sharp complex are evident, often time-locked with myoclonic jerks. (B,C) EEG during the evolution in refractory SE, in the from of a myoclonic SE. The patient is under general anesthesia with barbiturates plus antiepileptic drugs poly-therapy. (D) Represents the EEG evolution during recovery. EEG recording parameters: high-pass filter: 0.3 Hz; low-pass filter 50 Hz. EMG parameters: high-pass filters 50 Hz; low-pass filter 250 Hz. Sampling frequency 1,024 Hz.

