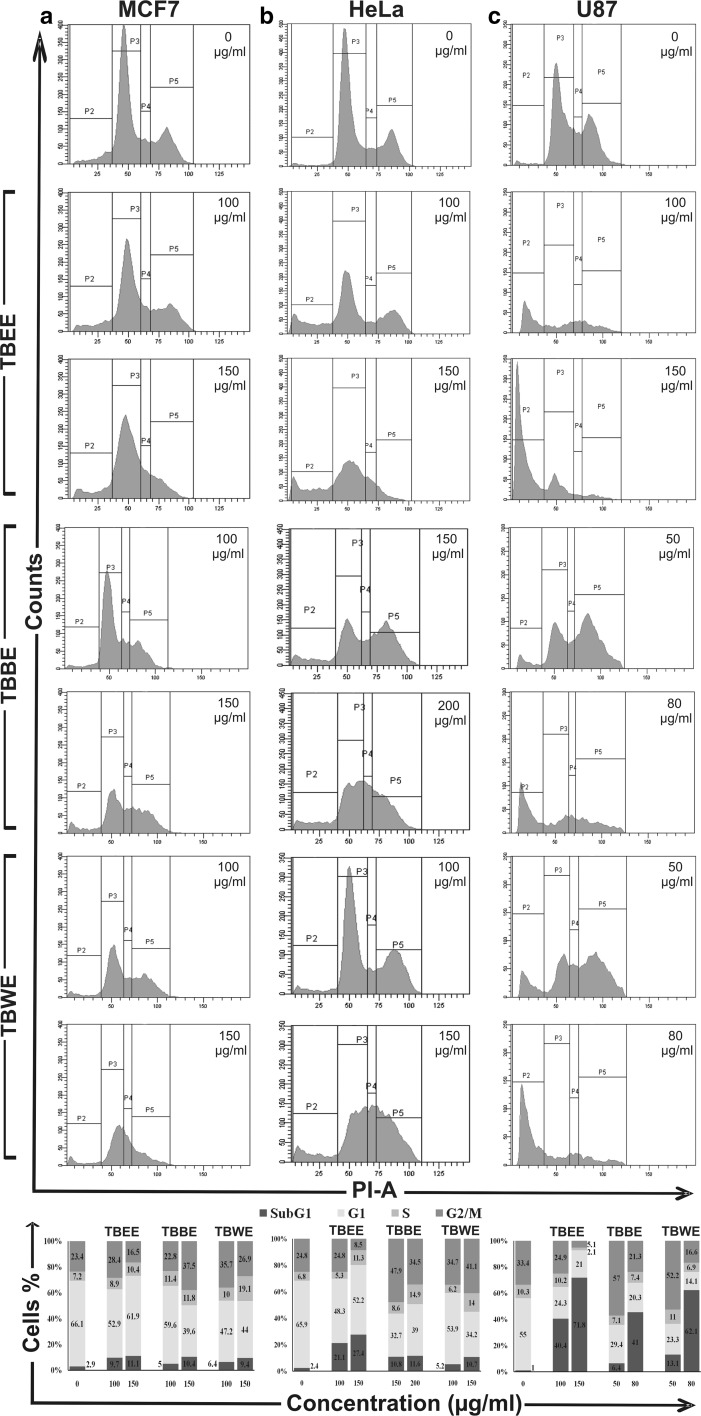
Fig. 5.
Flow cytometric analysis of cell cycle distribution of cells treated with TBEE, TBBE and TBWE with graphical representation of percentage of cell population in different phases for a MCF-7, b HeLa and c U87 cells. MCF-7 cells were treated with 100 and 150 µg/ml of TBEE, TBBE and TBWE. HeLa cells were treated with 100 and 150 µg/ml of TBEE, 150 and 200 µg/ml of TBBE and 100 and 150 µg/ml of TBWE. U87 cells were treated with 100 and 150 µg/ml of TBEE and 50 and 80 µg/ml of TBBE and TBWE

