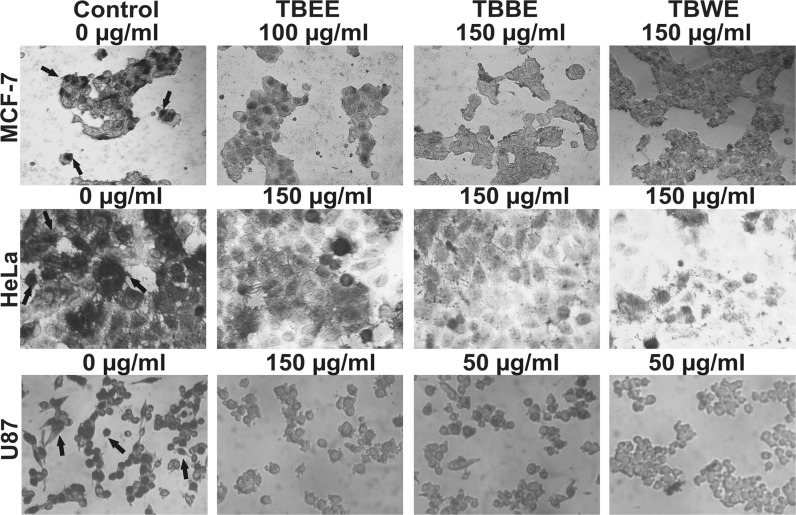
Fig. 6.
Photomicrograph of cancer cells having incorporated BrDU on treatment with TBEE, TBBE and TBWE. MCF-7 cells were treated with TBEE (100 µg/ml), TBBE (150 µg/ml) and TBWE (150 µg/ml), HeLa cells were treated with 150 µg/ml of TBEE, TBBE and TBWE and U87 cells were treated with TBEE (150 µg/ml), TBBE (50 µg/ml) and TBWE (50 µg/ml). Control cells showed dark black patches inside the cells (BrdU incorporation into healthy cells) while arrested cells showed a reduced number of stained nuclei and shrunken morphology. Black arrows indicate proliferative cells with BrdU incorporated into the nucleus

