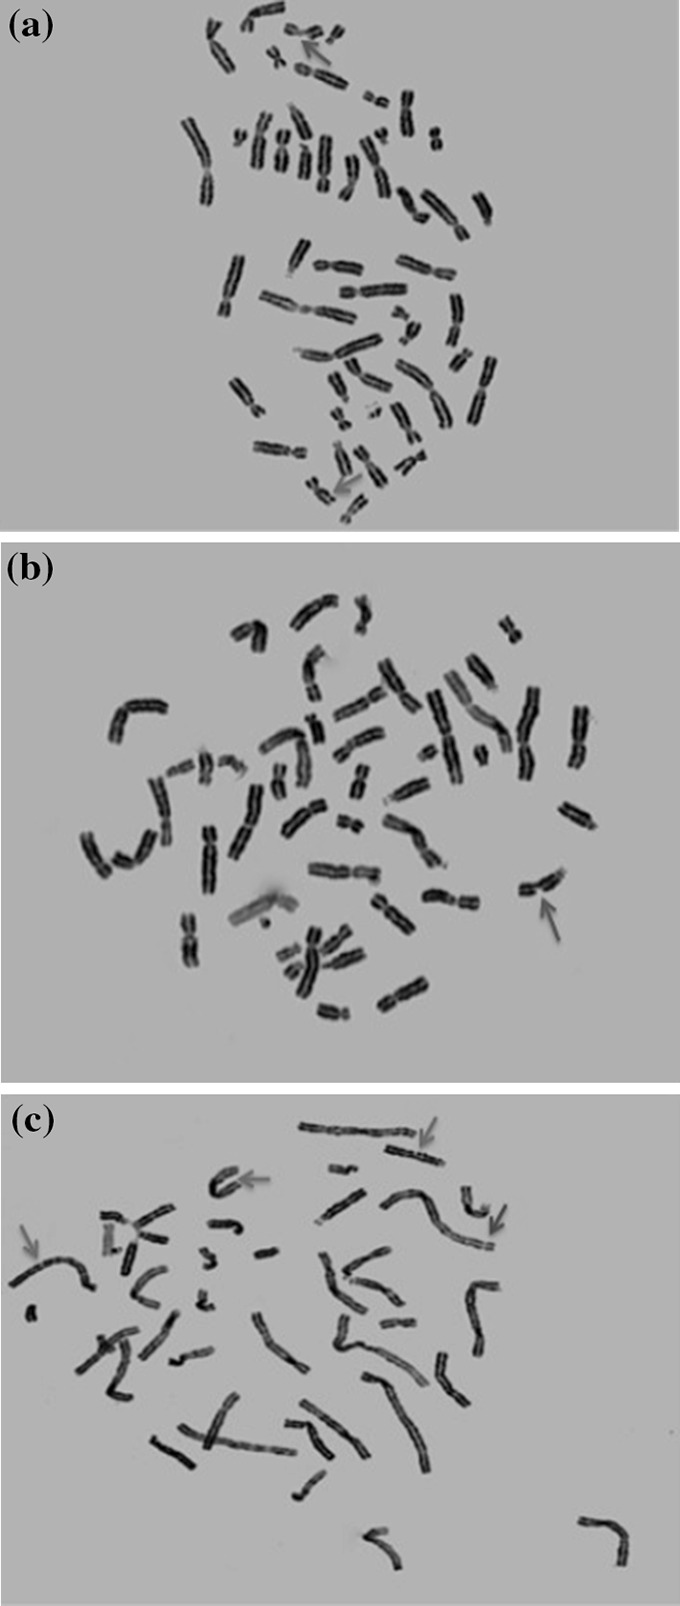
Fig. 10.

Photomicrographs of metaphase chromosomes. Arrows representing the aberrations are shown in green (chromatid gap), blue (chromatid break), and red (chromosomal break). a Single chromatid gap and break each. b Single chromatid break. c 3 chromatid gaps and 1 chromosomal break
