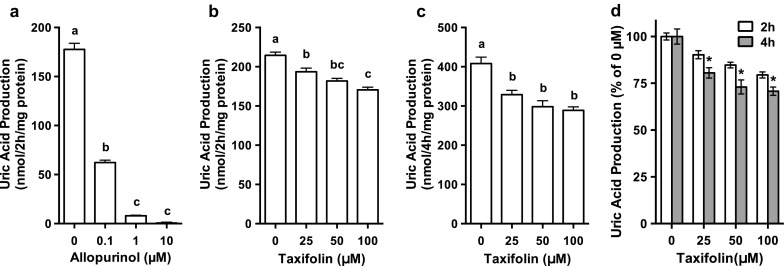
Fig. 2.

Effects of taxifolin and allopurinol on UA production in AML12 hepatocytes. AML12 cells were treated with 0.1, 1 and 10 µM allopurinol for 2 h (a) or with 25, 50 and 100 µM taxifolin for 2 h (b) or 4 h (c) in balanced salt solution containing guanosine + inosine (100 µM each). d indicates relative UA production by AML12 cells treated with taxifolin for 2 or 4 h, data being expressed as percentage of the 0 µM taxifolin. Each value represents mean ± SEM for six wells (duplicate measurements per well). Values not sharing a common letter are significantly different at P < 0.05 (Tukey’s test). *P < 0.05 compared with the 2 h-treated group with the corresponding concentrations by unpaired t test
