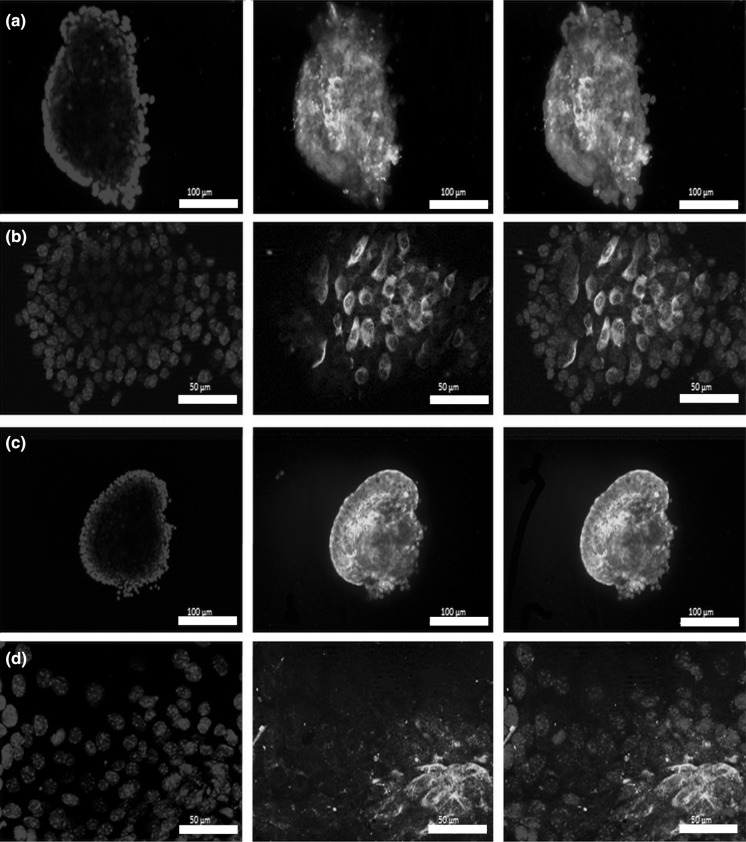
Fig. 2.
Validation of mouse pancreatic islets right after isolation by immunofluorescent (IF) staining. We performed glucagon (a and b, green) and insulin (c and d, green) IF staining counterstained with DAPI to visualize nuclei (blue). Scale bars indicate 100 µm (a and c), 50 µm (b and d). (Color figure online)

