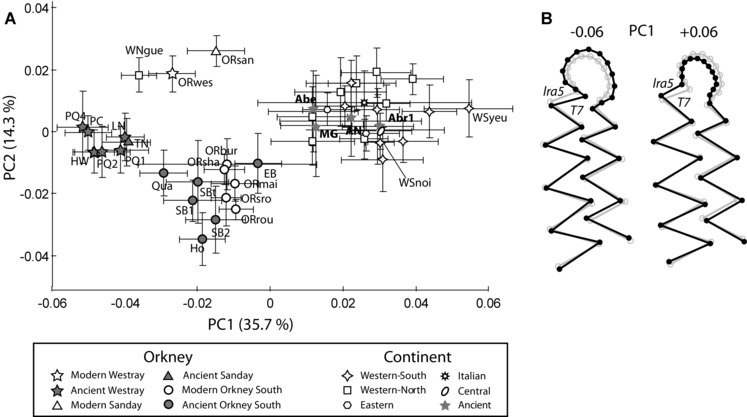
Figure 4.

Molar shape differentiation of modern and ancient Microtus arvalis samples from continental Europe (islands included) and Orkney. (A) Scatter plot of the two first principal components of the morphometric analysis. Each symbol with its group code (Tables 1 and 2) corresponds to the mean value of a modern or ancient group, bracketed by the 95% confidence interval. (B) Molar shape change associated with PC1 is depicted with a wireframe graph connecting the landmarks and semilandmarks. The gray wireframe represents the mean shape and the black wireframe represents the shape changes along PC1 in negative (−0.06) and positive (+0.06) directions.
