
Figure 7.
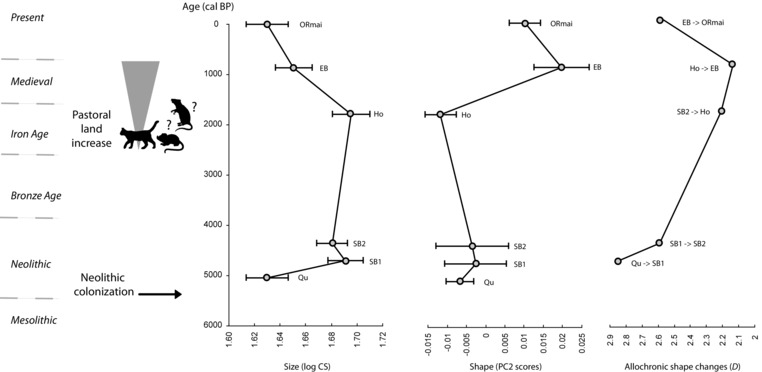
Morphological change over time in Mainland Orkney voles. (1) Molar size evolution depicted by mean size with confidence intervals. (2) Molar shape evolution depicted by mean scores along the second principal component axis detailed in Figure 6. (3) Allochronic shape changes expressed as Mahalanobis's distances (D) between each chronological step of the time series.