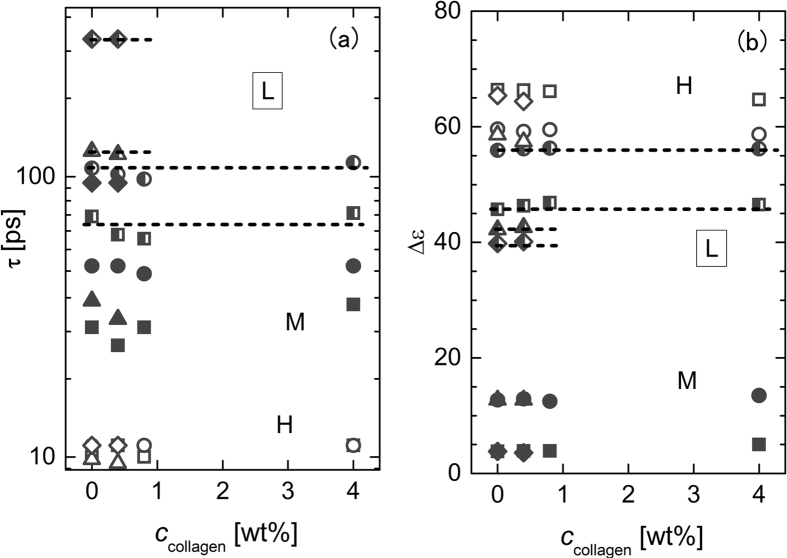
Figure 4. Relaxation times and strengths for the L, M, H processes versus collagen concentration.
Plots of (a) dielectric relaxation time and (b) dielectric relaxation strength versus collagen concentration for dielectric relaxation process (half-filled symbol: L; filled symbol: M; open symbol: H) in aqueous collagen solutions with different amino acids (square: glycine; circle: β-alanine; triangle: L-serine; diamond: L-arginine). The values of the molar fractions of amino acids relative to water are listed in Table 2. In Fig. 4(a), the values of the relaxation time of the L, M, and H processes for all the amino acids employed in this study are plotted versus the concentration of collagen in the aqueous solutions. Figure 4(b) presents similar plots for the relaxation strength. At ccollagen = 0 (no collagen), the values for the relaxation time of the L process depend on the amino acid type, as discussed above. Note that the relaxation time and the strength of the L process for the specific amino acid are almost constant with collagen concentration within the experimental uncertainty.

