
Fig. 2.
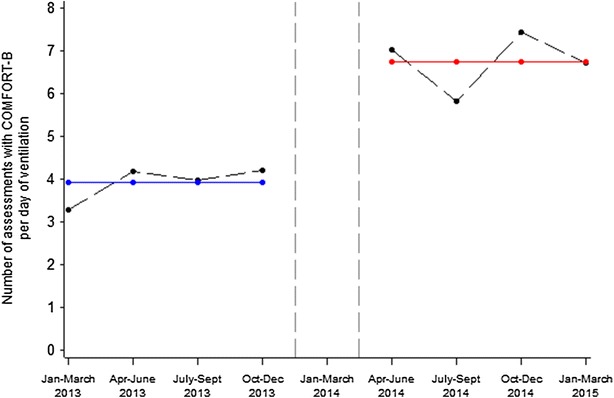
Mean number of COMFORT-B assessment per day on mechanical ventilation over time. Observed data are presented with black dots, and predicted data with segmented regression analysis are presented in blue for pre-implementation and red for post-implementation. Vertical dashed lines represent the 4-month implementation period