
Fig. 3.
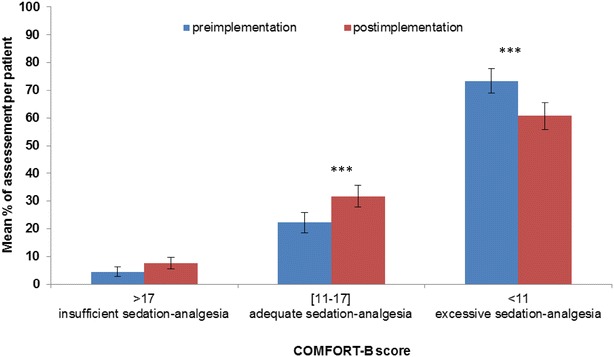
Distribution of COMFORT-B scores per level of sedation and analgesia before and after the protocol implementation. Bars represent 95% confidence interval, ***p < 0.001
Official websites use .gov
A
.gov website belongs to an official
government organization in the United States.
Secure .gov websites use HTTPS
A lock (
) or https:// means you've safely
connected to the .gov website. Share sensitive
information only on official, secure websites.
Distribution of COMFORT-B scores per level of sedation and analgesia before and after the protocol implementation. Bars represent 95% confidence interval, ***p < 0.001