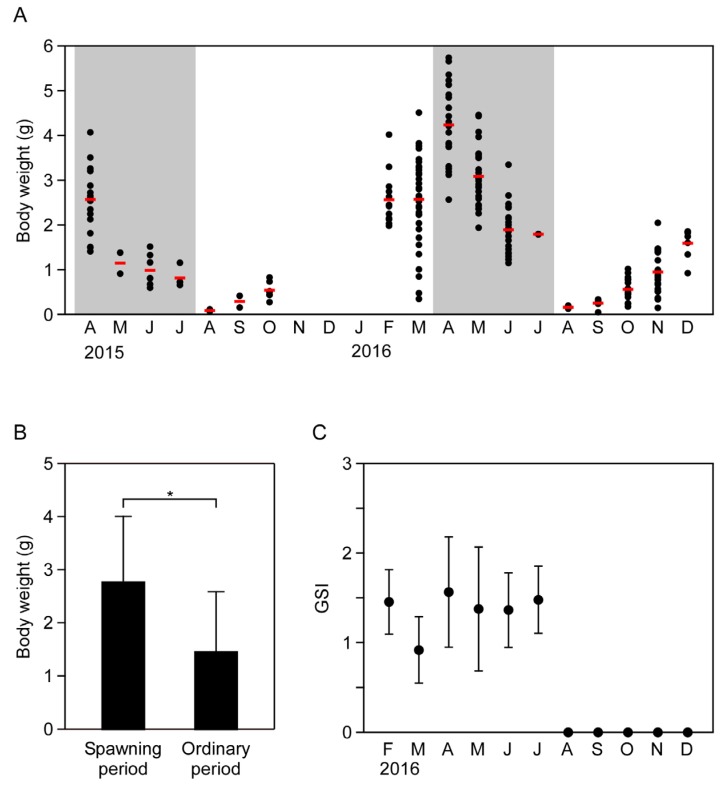
Figure 1.
Seasonal changes in body weight and gonadosomatic index (GSI) of the flatworm Planocera multitentaculata. (A) Seasonal changes in the body weight. Circles and red bars represent individual and mean data, respectively; (B) Differences in body weight between spawning period and other times of the year. Student’s t-test was used for the analyses (* significant at p < 0.05); (C) Seasonal changes in GSI. Data are means ± standard deviation.

