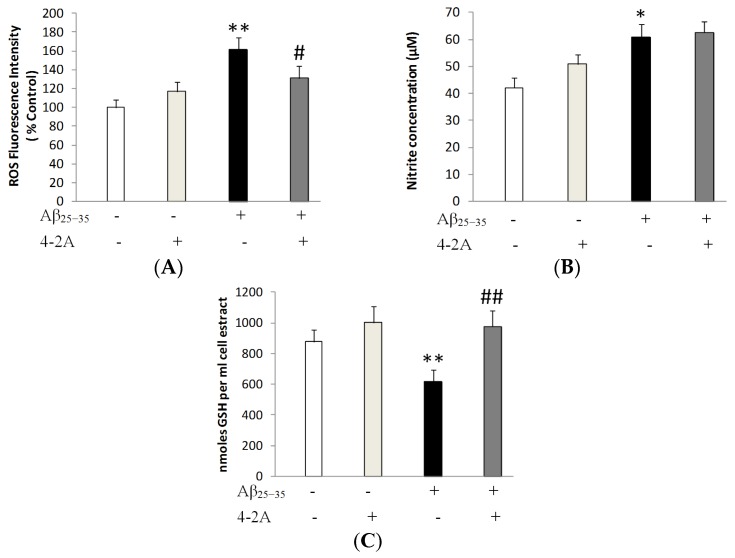
Figure 6.
The effect of 4-2A on the changes of oxidative and anti-oxidative response induced by Aβ25–35. (A) ROS production in fully differentiated SH-SY5Y cells treated with Aβ25–35 20 μM and/or 4-2A 10 μM for 24 h. Data represent mean ± SEM percentage of control. (B) NO production and (C) GSH content in fully differentiated SH-SY5Y cells treated with Aβ25–35 20 μM and/or 4-2A 10 μM for 24 h. Data represent mean ± SEM of concentration (μM per mL). The statistics were based on data from six separate experiments, n = 6 in each experiment. * p < 0.05, ** p < 0.01 vs. control group; # p < 0.05, ## p < 0.01 vs. Aβ25–35 group.

