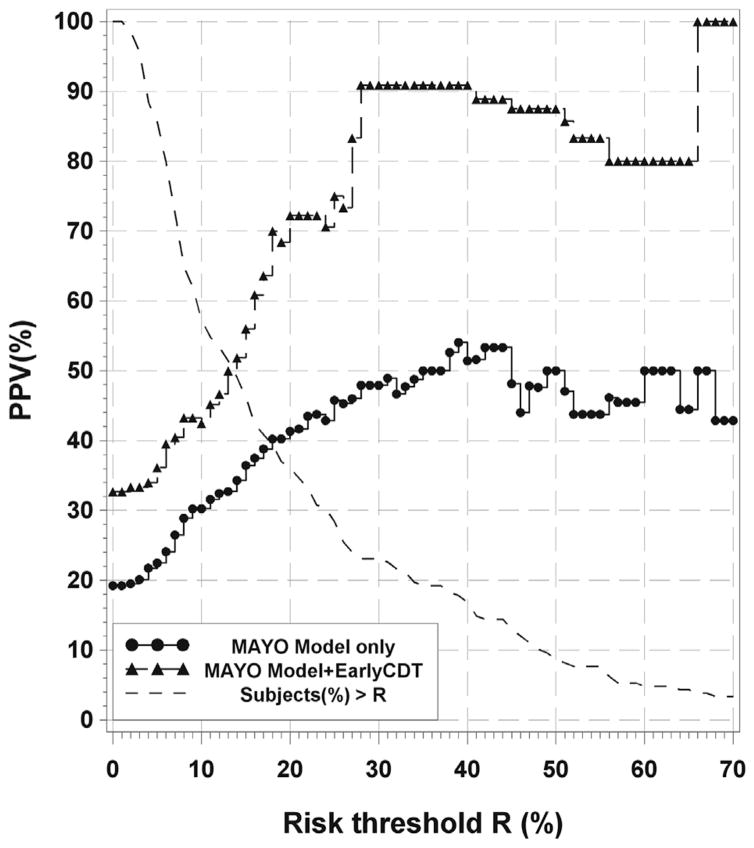
Figure 3.
Plot of positive predictive value (PPV) versus risk threshold (R) for the MAYO model. Curves are shown for the MAYO model only (black line with dots) and the MAYO model plus EarlyCDT-Lung (gray dashed line with triangles). Also shown is the plot of the percentage of subjects with an individual risk below R on the x axis (black dashed line). Adding EarlyCDT-Lung improves the PPV over the whole range. For a chosen risk threshold, a patient is risk model–positive if his or her calculated individual risk is greater than the threshold. The procedure could be as follows: Choose R (30%, for example) and then read off the model-only PPV for patients with a risk higher than R (48% in this example) and then with an EarlyCDT-Lung–positive result added (91%). Finally, read off the percentage of patients in the population with a risk higher than R (23%). The number of false-positive results is reduced at the expense of fewer cancers detected. So choose the value of R giving the most useful performance (inclusive cohort, 4 mm–20 mm [n = 208]).

