Figure 3.

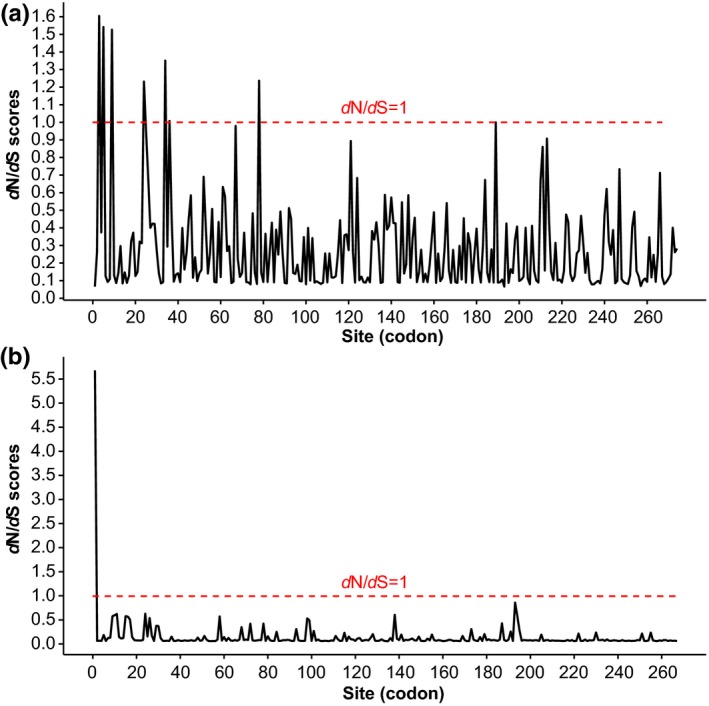
Sliding window plot of dN/dS ratios for P1 (a) and CP (b) genes. Sites under neutral (dN/dS = 1) are indicated in red dotted line. The window size is 20 codons, and the offset between windows is one codon

Sliding window plot of dN/dS ratios for P1 (a) and CP (b) genes. Sites under neutral (dN/dS = 1) are indicated in red dotted line. The window size is 20 codons, and the offset between windows is one codon