
Figure 1. Summary of the NRF2 qHTS screening results.
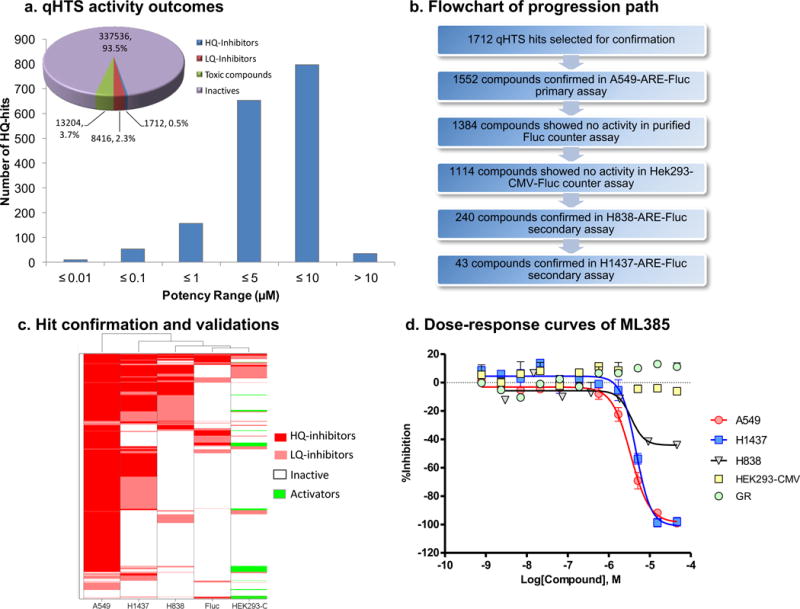
(a) Pie chart displaying the breakdown of the screening hit classes; high-quality (HQ) inhibitors are compounds in curve class −1.1, −1.2, −2.1, and −2.2 with efficacy higher than 50%; low-quality (LQ) inhibitors are compounds in curve class −3 with single point activity or those with shallow or poor-fitting curves; toxic compounds are those showing prominent cell killing effects from the cytotoxicity readout; inactives are compounds with class 4 curves. Histogram displaying the potency distribution of the HQ-inhibitors. (b) Assay flowchart for the validation of small molecule inhibitors of NRF2. (c) Heat map showing the activity profile of 1712 qHTS hits in 3 ARE NRF2 assays (A549, H1437, and H838 cells), purified firefly luciferase biochemical counter assay and HEK293-CMV counter assay. Compound IDs are given at right and the assay types are listed at the bottom of the heat map. Hierarchical clustering analysis was done using Spotfire DecisionSite 8.2. (d) Concentration-response curves of ML385 in three ARE NRF2-luc assays (A549, H1437, and H838 cells), HEK293-CMV counter assay and glucocorticoid receptor (GR)-responsive beta-lactamase reporter cell-based assay.