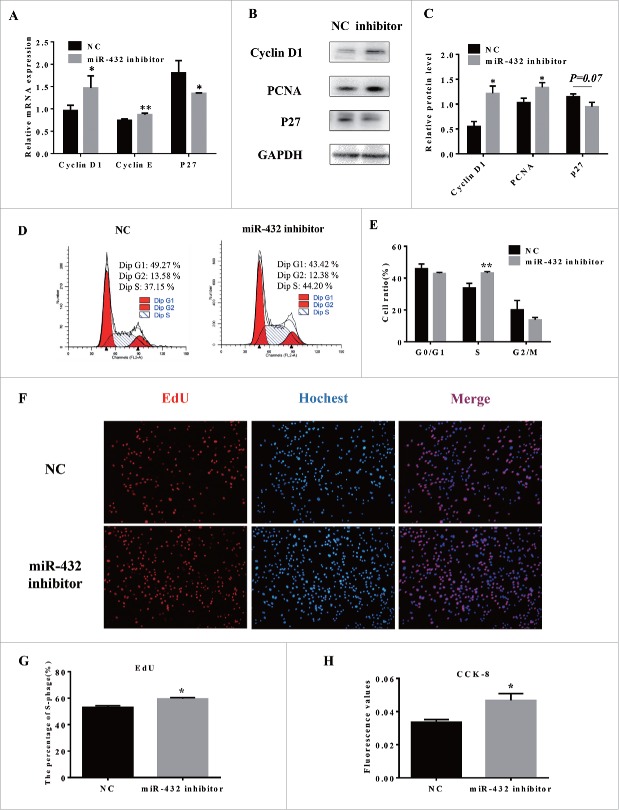
Figure 4.
MiR-432 inhibitor promoted proliferation of myoblasts. (A) RT qPCR analysis of cell cycle related genes after transfection for 24h. (B) Western blot analysis of Cyclin D1, Cyclin E, P27. (C) Quantification of Western blot analysis of Cyclin D1, Cyclin E, P27. (D) Flow cytometer was used to analyze cell cycle. (E) Statistics of cells number in different stages. (F) Edu staining of myoblasts after transfection for 24 h. Cells during DNA replication were stained by EdU (red) and cell nuclei were stained with Hoechst (blue). (G) Quantification of the percentage of EdU positive cells/total cells. (H) Cell cycle kit 8 was used to estimate total cell number and the data displayed the absorbtivity at 490nm. Data were shown by mean ± SD of three independent experiments. *, P < 0.05;**, P < 0.01.

