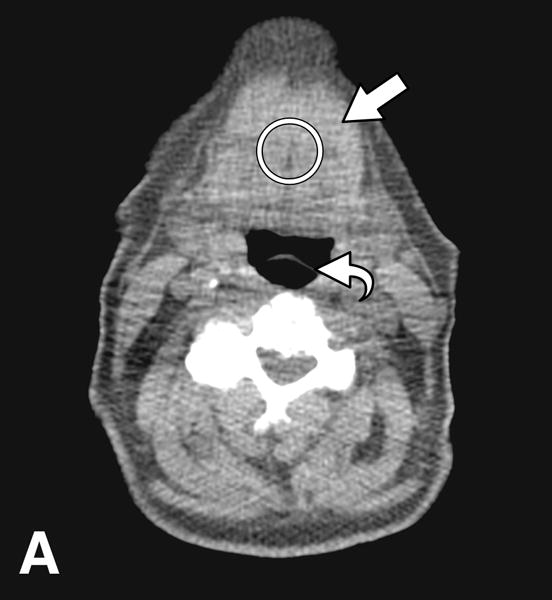
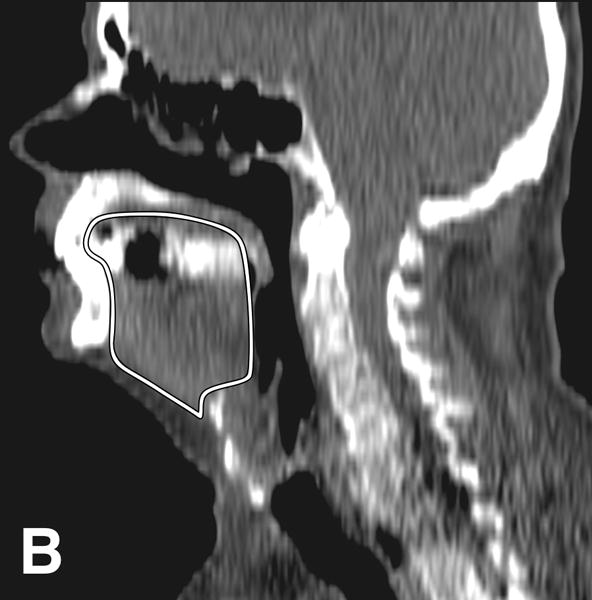
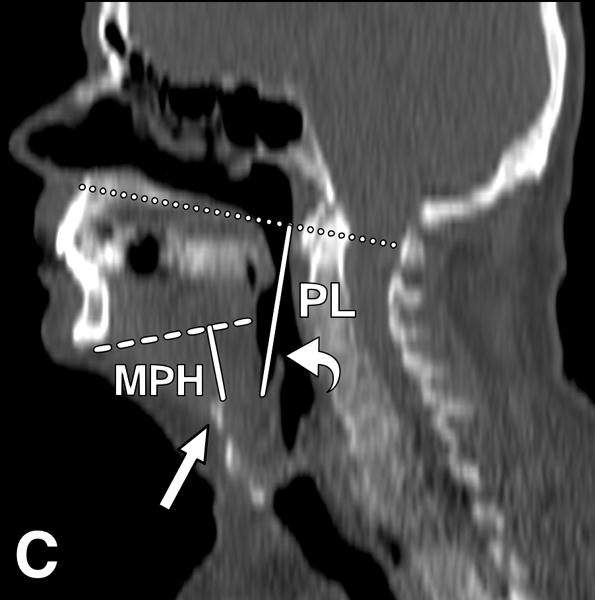
Figure 2.


CT images from an obese male subject aged 74 years, with BMI 30 kg/m2, TA: 15.4 HU, tongue cross sectional area (CSA) 35.8 cm2, mandibular plane to hyoid distance (MPH) 2.9 cm, and pharyngeal length (PL): 7.2 cm. (A) Measurement of tongue attenuation values by placing a region of interest (circle) in the central portion of the tongue (arrow) on an axial slice obtained at the level of the epiglottis (curved arrow). (B) Sagittal CT image reconstruction through the midline showing tracing (white line) of tongue cross sectional area. (C) Sagittal CT image reconstruction through the midline demonstrating hard palate plane (dotted line) and epiglottis (curved arrow) providing PL, and the mandibular plane (dashed line) and hyoid bone (arrow) yielding MPH measures.
