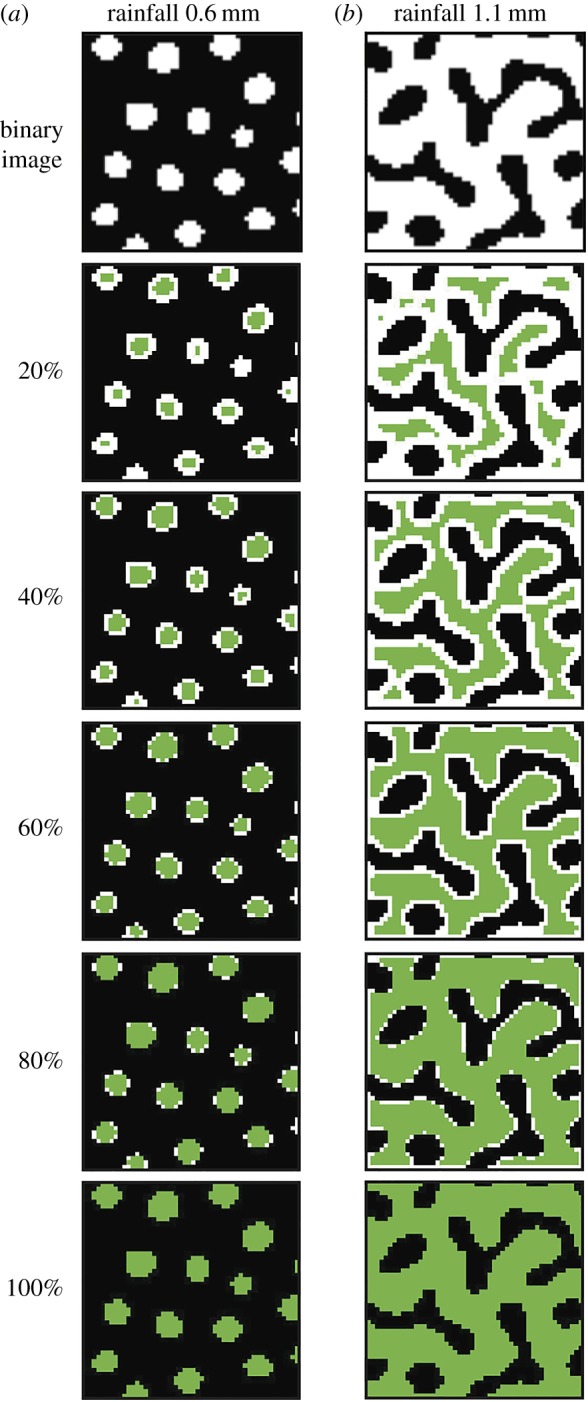
Figure 3.

Thumbnails showing sequences of expanding subregions of graphs derived from images of modelled vegetation at 0.6 mm rainfall per day (a) and 1.1 mm rainfall per day (b). In these examples, the graphs were derived from the foreground (white) pixels of each binary image, and the vertices are shown as green pixels. The expanding subregions in these examples begin with the vertices that were ranked in the top 20% according to SC, and lower-ranked vertices are added in 20% increments until 100% of the vertices are present.
