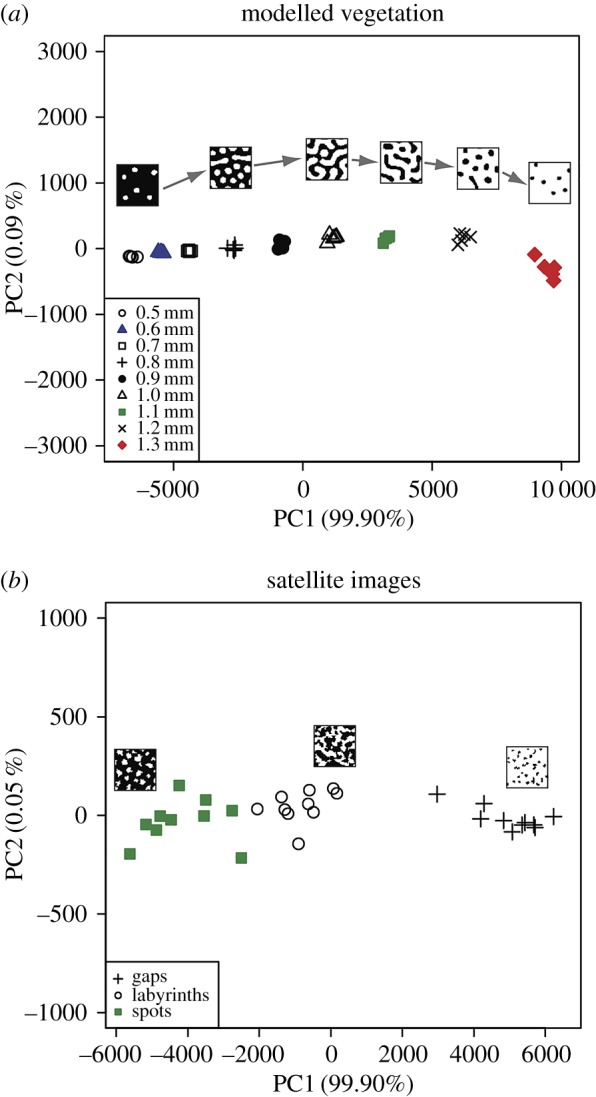
Figure 5.

Scatterplots showing the results of principal component analyses of the feature vectors used to describe modelled vegetation patterns (a) and vegetation patterns observed in satellite imagery (b). Vegetation patches in binary image thumbnails are represented by white pixels; bare ground interpatches are represented by black pixels. The sequence of thumbnails from left to right in (a) is as follows: 0.5 mm rainfall per day, 0.8 mm rainfall per day, 1.0 mm rainfall per day, 1.1 mm rainfall per day, 1.2 mm rainfall per day and 1.3 mm rainfall per day. The first principal component explains almost all the variance (greater than 99%) in the analyses of modelled (a) and real-world (b) vegetation patterns.
