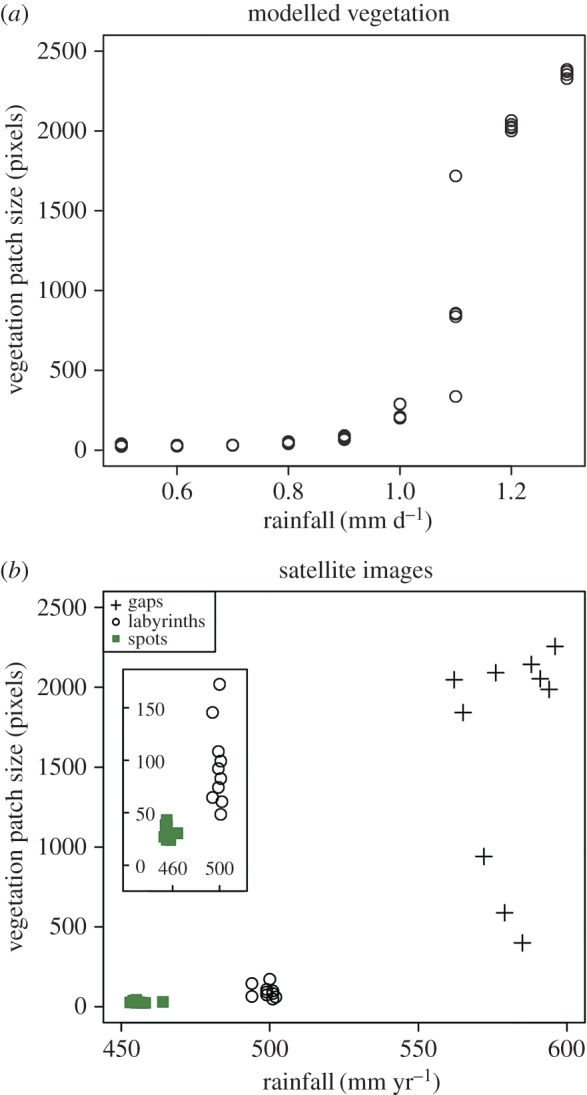
Figure 6.

Scatterplots showing the relationship between vegetation patch size and rainfall in modelled vegetation patterns (a), and the variations in vegetation patch size among three vegetation pattern types observed in satellite images (b). Inset in (b) shows the size of vegetation patches in labyrinth and spotted vegetation in more detail. Vegetation patch size calculated from binary images (see Material and methods) and reported in pixels. Where an image contained more than one vegetation patch (e.g. figure 1b 0.6 mm rainfall per day), size is reported as the average of all the vegetation patches present in the image.
