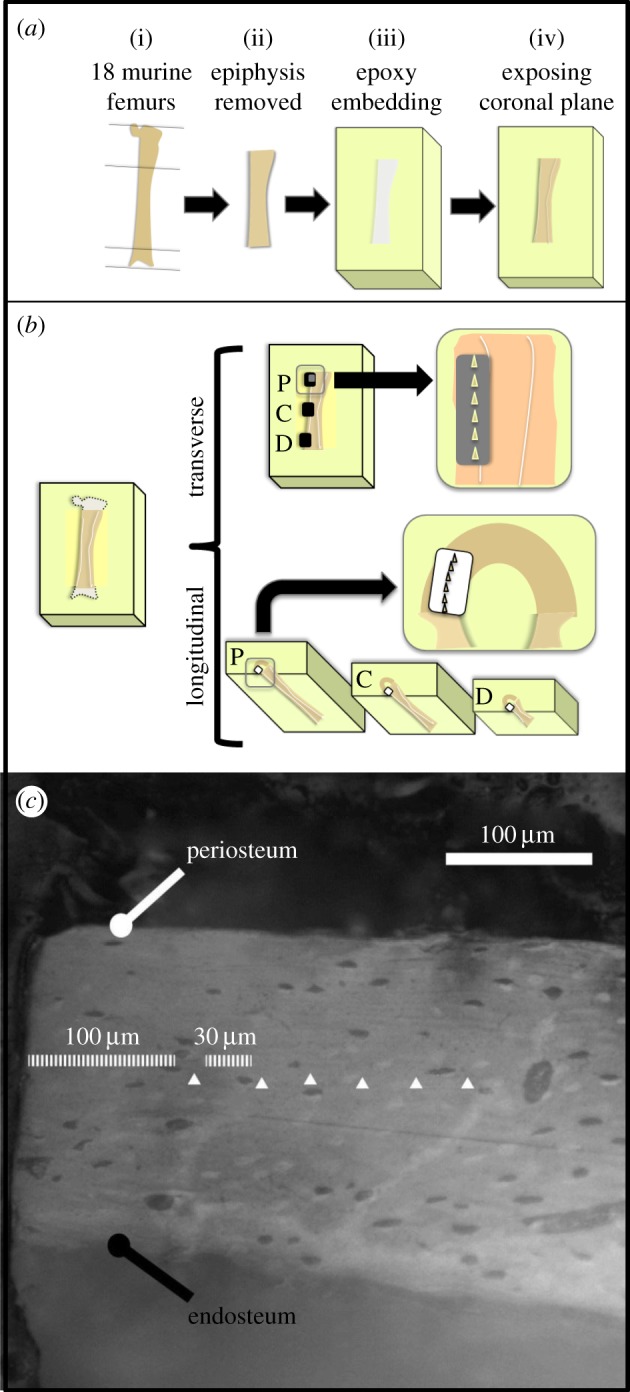
Figure 1.

(a) Schematic of the sample preparation procedure. (b) Location of the indentations on the mouse femur in the proximal (P) central (C) and distal (D) regions. (c) Image reporting the location of the indentations in the transverse direction (white triangles). Visible lacunae were carefully avoided.
