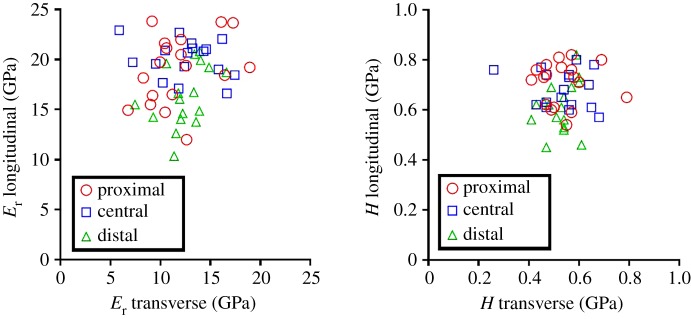
Figure 4.
Scatter plot for the reduced modulus (Er, a) and hardness (H, b) found in the two orthogonal directions in the proximal, central and distal locations. Each element in the plot represents a specific location (proximal, central or distal) of the same femur (18 femurs in total). Two points were removed (central and distal regions) owing to a misplacement of two set of indentations. No correlation was found.

