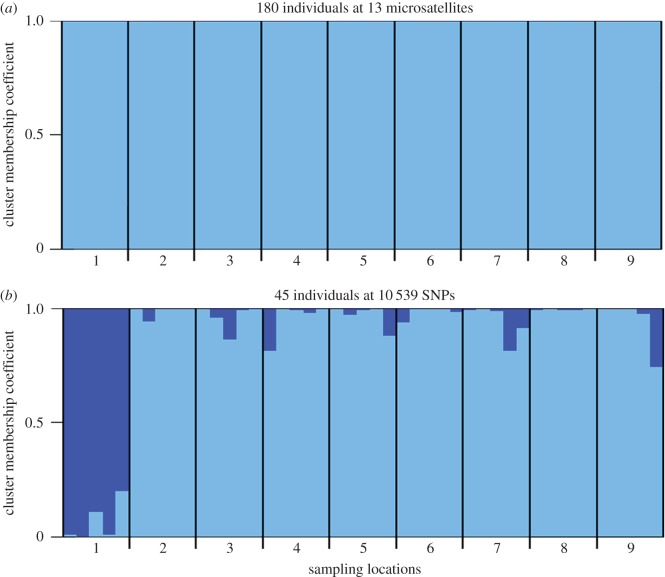
Figure 3.
Cluster membership coefficients of (a) 180 individuals genotyped at 13 microsatellites; and (b) 45 individuals genotyped at 10 539 SNPs. Each individual is represented by a vertical line partitioned into segments of different colour, the lengths of which indicate the posterior probability of membership in each group.

