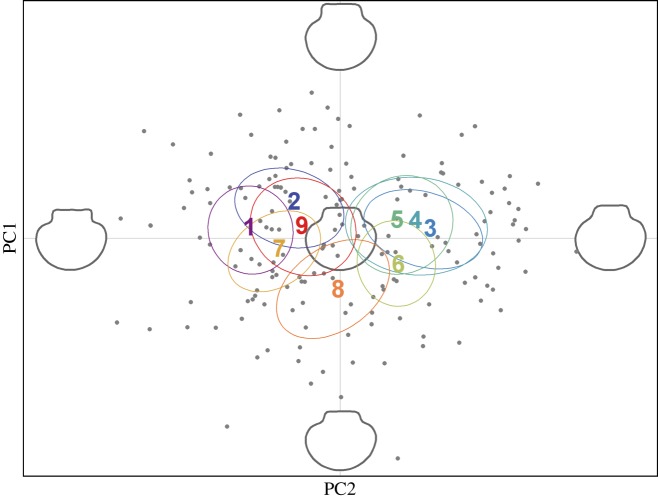
Figure 5.
Scatterplot showing individual variation in the first two principal components (PCs) derived from a principal component analysis (PCA) conducted on the elliptic Fourier coefficients of scallop shell shape. PC1 and PC2 explain 38.3 and 18.3% of the variation in shell shape respectively. Extreme and average reconstructed shell outlines are shown in grey.

