Figure 6.

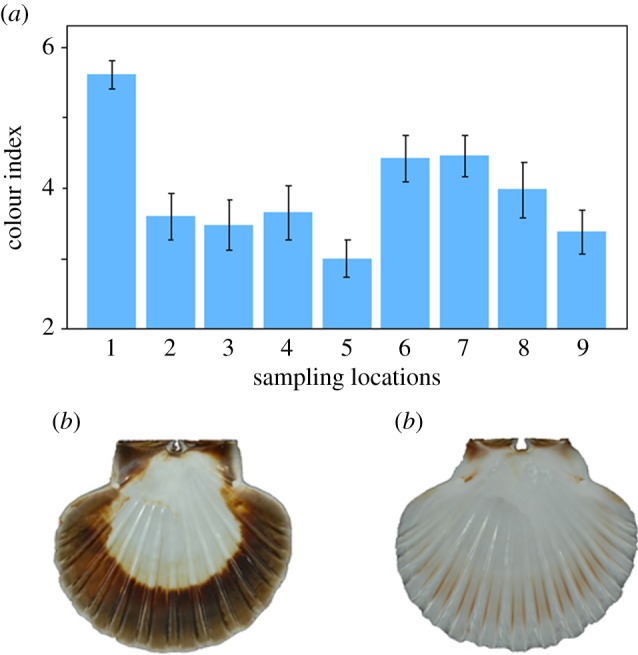
Colour variation among nine scallop populations. Panel (a) shows population-specific mean and standard error colour index values. Panels (b) and (c) show extreme colour phenotypes from Mulroy Bay and population five respectively.

Colour variation among nine scallop populations. Panel (a) shows population-specific mean and standard error colour index values. Panels (b) and (c) show extreme colour phenotypes from Mulroy Bay and population five respectively.