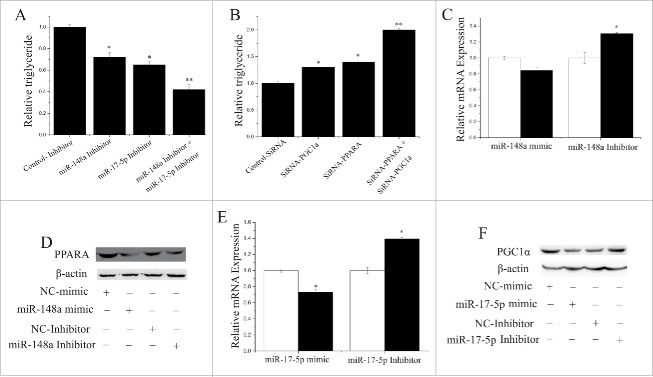
Figure 3.
Relationship between miR- 148a, miR-17–5p, PPARGC1A and PPARA (A) TAG concentrations in cells transfected with NC-Inhibitor (60 nM), miR-148a-Inhibitor (60 nM), miR-17–5p-Inhibitor (60 nM), miR-148a-Inhibitor (30 nM) and miR-17–5p-Inhibitor (30 nM); TAG concentrations are compared with the control (n = 6). (B) TAG concentrations in cells transfected with NC-Inhibitor (60 nM), SiRNA-PPARGC1A (60 nM), SiRNA-PPARA (60 nM), SiRNA-PPARGC1A (30 nM) and SiRNA-PPARA (30 nM); TAG concentrations are compared with the control (n = 6). (C) PPARA expression quantified by RT-qPCR (n = 6) in GMECs transfected with miR-148a mimic or inhibitor for 48 h. White bars: negative control; black bars: miR-148a mimic or inhibitor. (D) Western blot analysis of PPARA expression in the miR-148a mimic and NC treatment experiments. The effect of miR-148a mimics and Inhibitor on PPARA protein expression in GMECs was evaluated by Western blot analysis. Total protein were harvested after 48 h post-transfection, respectively. (E) PPARGC1A expression quantified by RT-qPCR (n = 6) in GMECs transfected with miR-17–5p mimic or inhibitor for 48 h. White bars: negative control; black bars:miR-17–5p mimic or inhibitor. (F) Western blot analysis of PPARGC1A expression in the miR-17–5p mimic and NC treatment experiments. The effect of miR-17–5p mimics and Inhibitor on PPARGC1A protein expression in GMECs was evaluated by Western blot analysis. Total protein were harvested after 48 h post-transfection.

