Figure 5.
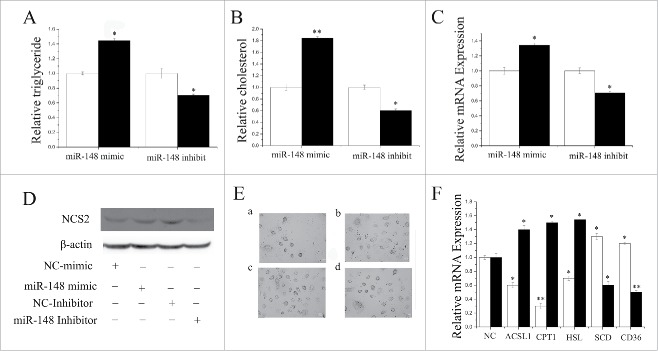
Functional evaluation of miR-148a (A) TAG concentrations in cells transfect with miR-148a mimic (60 nM) or inhibitor (60 nM); TAG concentrations were compared with that of control (n = 6). White bars: negative control; black bars:miR-148a mimic or inhibitor. (B) Cholesterol concentrations in cells transfected with miR-148a mimic (60 nM) or inhibitor (60 nM); cholesterol concentrations were compared with that of control (n = 6). White bars: negative control; black bars: miR-148a mimic or inhibitor. (C) mRNA expression of β-Casein quantified by RT-qPCR (n = 6) in GMECs transfected with miR-148a mimic or inhibitor for 48 h. White bars: negative control; black bars: miR-148a mimic or inhibitor. (D) Western blot analysis of β-Casein expression in the miR-148a mimic or inhibitor treatment experiments. The effect of miR-148a mimic or inhibitor for 48 h on β-Casein protein expression in GMECs was evaluated by Western blot analysis. Total protein was harvested for 48 after post-treatment. (E) Changes in the lipid content of GMECs transfected with miR-148a mimic or inhibitor for 48 h. Cells were stained with oil red O. After examination microscopically, the oil red was extracted with 400 µl of isopropanol and its absorbance determined at 510 nm. The relative fat droplet content was normalized to control transfected cells. a: NC mimic treatment, b: miR-148a mimic treatment, c: NC inhibitor treatment, d: miR-148a inhibitor treatment (F) Expression of fat metabolism related genes GMECs are transfected with miR-148a mimic or inhibitor for 48h, and the mRNA expression of ACSL1, CPT1, HSL, SCD and CD36 are quantified by RT-qPCR (n = 6). White bars: miR-148a mimic; black bars: miR-148a inhibitor. All experiments were duplicated and repeated 3 times. Values are presented as means ± standard errors, *, P < 0.05; **, P < 0.01.

