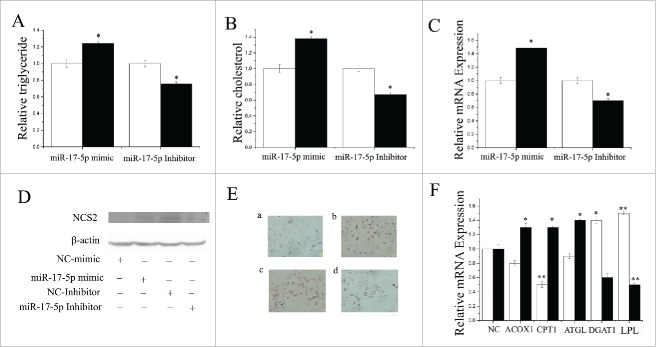
Figure 6.
Functional evaluation of miR-17–5p (A) TAG levels in cells transfect with miR-17–5p mimic (60nM) or inhibitor (60nM); TAG levels are compared with that of control (n = 6). White bars: negative control; black bars:miR-17–5p mimic or inhibitor. (B) Cholesterol levels in cells transfect with miR-17–5p mimic (60nM) or inhibitor (60nM); cholesterol levels are compared with that of control (n = 6). White bars: negative control; black bars:miR-17–5p mimic or inhibitor. (C) GMECs are transfected with miR-17–5p mimic or inhibitor for 48h, and the mRNA expression of β-Caseinis quantified by RT-qPCR (n = 6). White bars: negative control; black bars: miR-17–5p mimic or inhibitor. (D) Western blot analysis of β-Casein expression in the miR-17–5p mimic or inhibitor treatment experiments The effect of miR-17–5p mimic or inhibitor for 48h on β-Casein protein expression is evaluated by western blot analysis in GMECs. Total proteins are harvested for 48h post-treatment, respectively. (E) Changes in the lipid contents of GMECs transfect with miR-17–5p mimic or inhibitor for 48h. Cells were stained by oil red. After examined microscopically, the oil red o is extracted with 400 µl of isopropanol and its absorbance is determined at 510 nm. The relative fat droplet contents are normalized to control transfected cells. a: NC mimic treatment, b: miR-17–5p mimic treatment, c: NC inhibitor treatment, d: miR-17–5p inhibitor treatment (F) Expression of fat metabolism related genes GMECs are transfected with miR-17–5p mimic or inhibitor for 48h, and the mRNA expression of ACOX1, CPT1, ATGL, DGAT1 and LPL are quantified by RT-qPCR (n = 6). White bars:miR-17–5p mimic; black bars:miR-17–5p inhibitor. All experiments are duplicated and repeated for 3 times. Values are presented as means ± standard errors, *, P < 0.05; **, P < 0.01.

